
- DOGE remains above the $0.0600-$0.0800 weekly accumulation zone, which analysts view as a potential long-term reversal area.
- Ali Charts identified $0.081 as key support, with a move toward $0.177 possible if the level continues to hold.
- DOGE momentum remains cautious as RSI stays below 50, while $0.0875 and $0.0900 mark nearby resistance levels.
Dogecoin is trading near $0.0847 as analysts Kamran Asghar and Ali Charts point to separate technical levels. Asghar identified $0.0600-$0.0800 as a weekly accumulation zone, while Ali cited $0.081 as support. Their analyses follow DOGE’s decline from about $0.095 toward current levels, with technical indicators showing cautious momentum.
DOGE Retests a Long-Term Accumulation Zone
Asghar said Dogecoin is retesting the $0.0600-$0.0800 weekly accumulation zone. He compared the current setup with the base that preceded a previous 484% bull run. His analysis labels the structure a weekly accumulation and macro reversal setup.
Asghar set a macro target above $0.4800, while the stated current price stood at $0.0845. The one-hour chart shows prices falling from $0.094-$0.095 around Aug. 23-24. DOGE later recovered toward $0.089-$0.090 on Aug. 27-28.
However, sellers rejected that move, sending the price back toward $0.0840-$0.0850. Price has since stabilized around $0.0847, with buyers defending nearby support.
Ali Charts Points to $0.081 Support
Ali Charts said he bought Dogecoin after a monthly Tom DeMark Sequential produced a buy signal last month. He linked the signal to a potential change from bearish conditions toward bullish conditions.
Ali also said large holders accumulated more than 430 million DOGE over the past week. Based on URPD data, he identified $0.081 as a level that needs to hold. If that level holds, Ali said DOGE could move toward $0.177.
He also noted that little on-chain resistance exists between those levels. Meanwhile, the one-hour chart shows immediate support around $0.0840-$0.0843. A break below that area could expose the $0.0820-$0.0830 range.
DOGE Momentum Remains Cautious
The chart’s RSI is at 43.39, below the neutral 50 level. Its moving average is at 46.74, keeping bearish momentum slightly stronger. However, RSI has recovered from roughly 30-35, showing that selling pressure has eased.
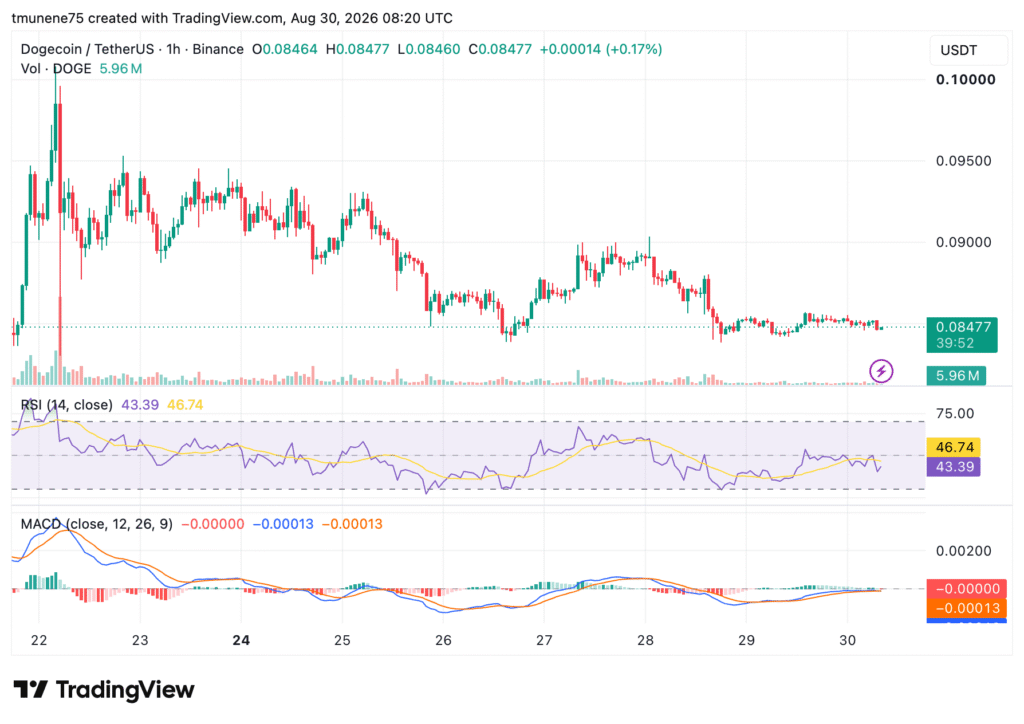
Resistance is around $0.0865-$0.0875, followed by $0.0890-$0.0900. The MACD remains marginally bearish at about -0.00013, with its histogram near zero. The indicator readings show weakening momentum and a possible shift toward sideways trading.
A move above $0.0875 would put $0.089-$0.090 resistance in focus. Meanwhile, $0.0840 remains the nearby downside level.