
- LINK trades near $13.15 after gaining 1.66% daily, despite a 7.22% weekly decline and continued corrective-wave uncertainty.
- The B-wave scenario may be supported with a three-wave rebound between the $13.43 and $14.24 levels of Fibonacci resistance.
- Exchange heatmaps show widespread net outflows, while Binance leads spot volume and derivatives activity remains elevated across markets.
LINK is entering a crucial technical development stage where a corrective rebound is forming, while price resisters, exchange flows, and derivatives are setting the market conditions.
LINK Rebound Develops Within a Corrective Structure
More Crypto Online states that the ongoing rebound could represent a B-wave. The analyst expects another decline if the recovery develops into three waves. This interpretation places the current advance within a broader corrective structure.
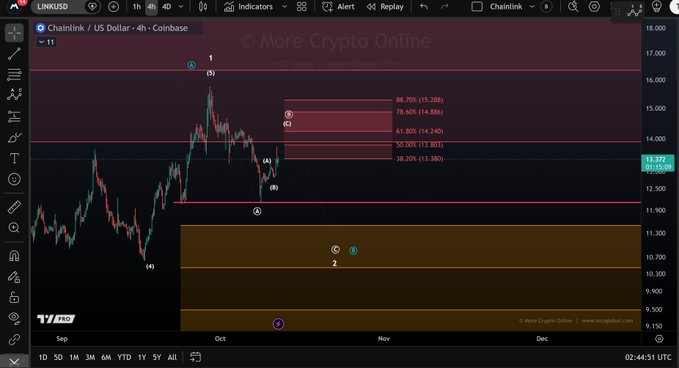
The four-hour chart shows an earlier rally toward $15.80 during early October. The advance then reversed, pushing prices back towards support below $11.90. The ongoing recovery is from this downtrend, but isn’t a confirmation of an uptrend.
The Elliott Wave count designates the preceding pullback as a completed 5 Wave movement. The following decline is the wave A and the present rebound is the wave B, and in this way, a C-wave decline may occur after the rebound is completed.
This interpretation has always focused on the internal structure of the recovery. Any three wave advance is more indicative of the proposed corrective count than it is of sustained bull momentum. However, a stronger impulsive advance could require reassessing the existing wave structure.
Fibonacci Levels Define the Immediate Resistance Zones
The chart identifies several Fibonacci retracement levels above the recent trading range. Resistance appears near $13.43, corresponding to the 38.2% retracement. Further levels sit at $13.80 and $14.24, representing the 50% and 61.8% retracements.
The displayed price is approximately $13.15, leaving several resistance levels overhead. A move above $13.43 would extend the rebound beyond its current range. Price behavior around 13.80–14.24 could then help assess the correction’s strength.
Higher retracement levels appear near $14.87 and $15.29 on the chart. These zones could become relevant if the recovery extends beyond intermediate resistance. Reaching them would not independently confirm that the corrective rebound had ended.
On the downside, $11.90 remains the nearest marked support. A sustained break beneath this level would strengthen the proposed C-wave scenario. The chart also identifies a broader potential downside region between $10.70 and $11.30.
Exchange Flows and Derivatives Provide Additional Context
The exchange heatmaps show Binance leading the selected one-hour spot-volume readings. Its displayed volume reaches $1.83 million, compared with $535,060 on OKX. Bybit records approximately $494,330, while Gate and Coinbase show lower totals.
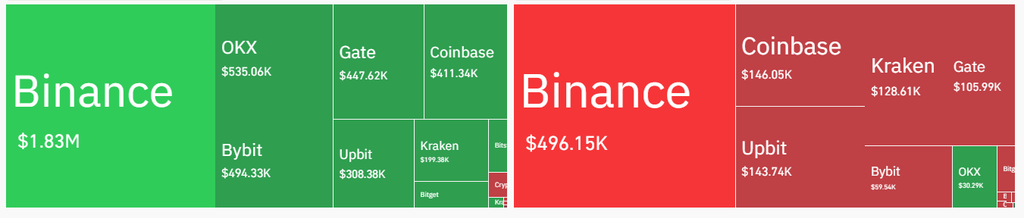
The net-flow panel displays approximately $496,150 in negative flows for Binance. Coinbase, Kraken, Gate, and Upbit also show negative readings. OKX contrasts with these venues, recording a positive flow of approximately $30,290.
The flows in these readings are not definitive proof of long-term accumulation. Outflows could be transfers from wallet to wallet, exchanges or custody. Thus, they will only have a directional meaning when used with the price action and after holding for some time.
Over the last 24 hours there was $438.59 million in futures volume on the larger derivatives figures. Spot volume has reached $71.09 million and open interest has increased to $632.46 million. These figures indicate substantial derivatives participation without establishing a definitive market direction.
LINK is reported near $13.15, up 1.66% over 24 hours. However, its seven-day performance remains negative at 7.22%. The combination of a daily recovery and weekly weakness leaves the broader price structure unresolved.
Rebound’s structure and its reaction to the resistance is the immediate concern. A 3 wave recovery would keep the opportunity for more lower support zone declines. On the other hand, if it remained strong above resistance, it would be necessary to review the proper interpretation and its range of objectives.