
- DOGE’s monthly chart shows an inverted hammer, TD Sequential buy signal and developing doji similar to its August 2022 setup.
- Large holders accumulated more than 430 million DOGE over the past week as the token traded near $0.0700.
- A sustained break above $0.0813 could expose DOGE to the next resistance near $0.177, according to Ali Charts.
Dogecoin is showing a monthly setup that analyst Ali Charts says resembles August 2022 before a 145% rally. The analyst cited a Tom DeMark Sequential buy signal, an inverted hammer, and a developing doji candle. He also reported that large holders accumulated more than 430 million DOGE over the past week.
Dogecoin Forms Pattern Seen Before 145% Rally
Ali Charts said the monthly chart flashed the TD buy signal last month. He compared the current structure with August 2022, when DOGE formed an inverted hammer and TD buy signal. A doji candle followed that setup in 2022, before DOGE recorded a 145% monthly rally.
The current monthly chart has also developed an inverted hammer, TD buy signal, and developing doji. However, Ali Charts did not state that the same price move would occur again. He said the pattern could precede a significant move if the earlier sequence repeats.
Whale Accumulation Adds to the Technical Setup
The analyst also pointed to activity among large DOGE holders. According to Ali Charts, whales accumulated more than 430 million DOGE during the past week. That buying came as DOGE traded between roughly $0.0680 and $0.0725 from August 4 through August 16.
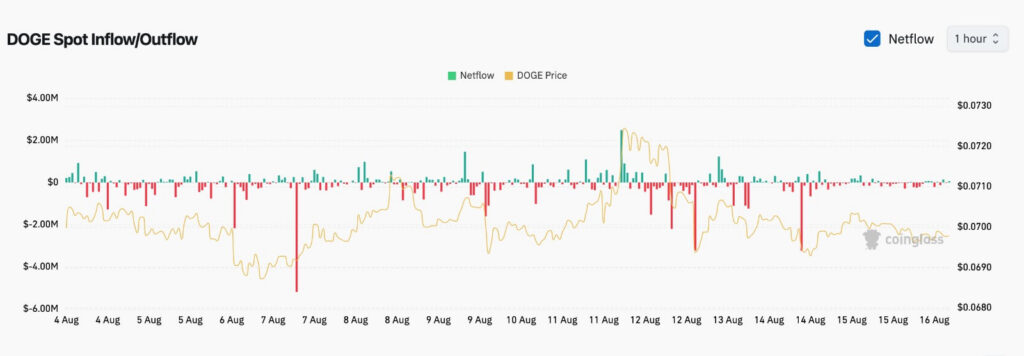
Spot flow data, however, showed mixed movement during the same period. The largest outflow appeared around August 7, reaching about $5.2 million. Other major outflows approached $3.5 million around August 6 and August 14.
By comparison, the strongest inflow reached roughly $2.5 million around August 11. DOGE climbed toward $0.0725 during that move before falling back toward $0.0700.
$0.0813 Remains the Main Resistance Level
Ali Charts identified $0.0813 as the key resistance area, where more than 30 billion DOGE were previously transacted. He said a sustained close above that level could open the next resistance near $0.177.
Meanwhile, spot flows weakened on August 15 and 16, with bars moving close to zero. DOGE traded around $0.0697-$0.0700 as flow pressure eased. The chart shows $0.0700 as a psychological pivot, with $0.0710 and $0.0720-$0.0725 above it. Below, $0.0690 and $0.0680 mark the next levels cited by the chart.