- SHIB Inu is testing a key support zone as traders assess whether buyers can sustain the latest recovery attempt.
- LBank leads reported SHIB futures open interest and trade counts, while OKX records the highest displayed trading volume.
- Rakuten Wallet’s reported physical coin giveaway could encourage community engagement, although its direct effect on SHIB demand remains uncertain.
SHIB Inu is approaching a critical technical juncture as traders monitor support levels, derivatives activity, and developments affecting community sentiment.
Support Levels Shape SHIB Inu’s Immediate Outlook
Whales Care (@WhalesCare) recently questioned whether SHIB holders would maintain their positions or exit during another support test. Its post describes a recurring pattern in which Shiba Inu approaches a price zone before bouncing. The buyers are approaching the 0.00000485–0.00000500 area on the supplied four-hour chart.
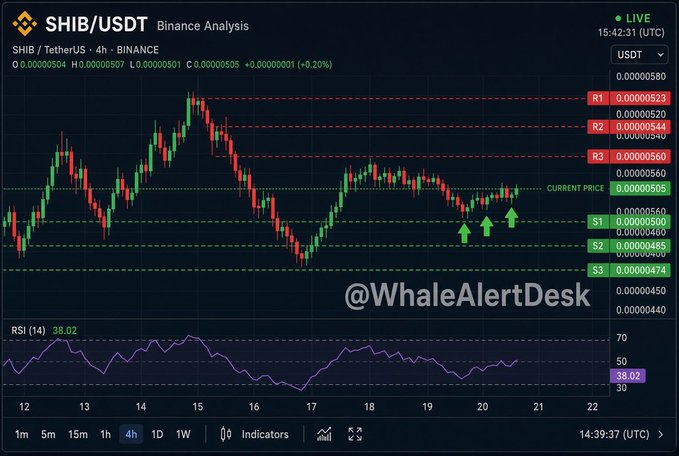
The indicated chart snapshot shows that SHIB is currently trading around $0.00000505, down from a price around $0.00000570. It later rebounded from a low of nearly $0.0000480 to begin a period of consolidation. This bounce, however, isn’t a guarantee of anything lasting, however.
The immediate support level stands near $0.00000500, followed by $0.00000485 and $0.00000474. If prices fall below these levels, the recovery structure could get weakened and further downside risk could be identified. Buyers, however, may be able to break through the resistance level if they defend the support.
The first resistance sits near $0.00000523, with additional barriers around $0.00000544 and $0.00000560. A convincing move up to the next barrier would be a more solid indication of momentum. So far the price is still susceptible to further selling pressure until then.
Futures Positioning Reveals Uneven Exchange Activity
The supplied derivatives dashboard tracks SHIB price movements alongside long and short positioning from April through October. There is a clearly noticeable spike in positioning around July 24 and another one in late August. These can be part of volatile conditions and are not clearly defined in the chart.
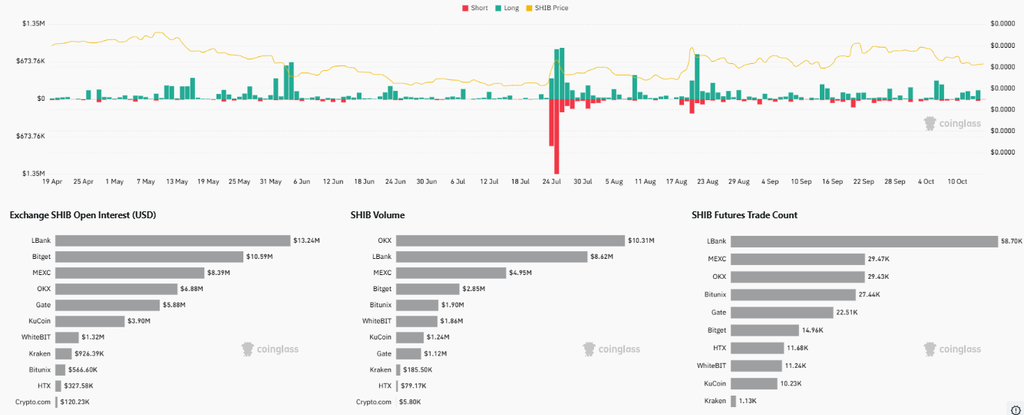
At roughly $13.24 million, LBank is the top exchange on the list of exchanges by open interest. Bitget is followed by MEXC with $10.59 million and OKX with $6.88 million. These are rise and fall figures and do not show a clear feeling among traders about direction.
Trading volume presents a different distribution across exchanges. OKX leads with approximately $10.31 million, followed by LBank at $8.62 million. MEXC recorded $4.95 million, placing it behind the two leading platforms.
LBank also records the highest displayed futures trade count, at approximately 58,700. MEXC (29,470) and OKX (29,430) come in second and third, respectively. Trade frequency is a measure of activity but cannot, on its own, determine the seller or buyer’s market control.
Community Developments Meet Uncertain Market Conditions
COINTURK (@CointurkMedia) reported that Rakuten Wallet would distribute physical coins to SHIB holders during a November 3 seminar. The post, translated, says that participants will need to prove ownership of SHIB by using the Rakuten Wallet app. There are no details of quantities or further eligibility criteria provided.
The reported initiative offers another way to engage existing SHIB holders. However, physical collectibles do not necessarily represent additional token distributions or fresh market purchases. Its direct effect on trading demand remains unclear without further information.
The same post indicated a 3.78% drop in SHIB over the past 24 hours. It also referred to inflation rates in the United States, which were at 3.7%, but did not assess a causal link. Inflation data could impact interest-rate views and overall risk sentiment.
The chart’s Relative Strength Index (RSI) was hovering around 38.02, which is below its neutral 50 level. This reading continues to show weakness, but the upward trend implies that selling pressure is easing. Higher than 50 with increased price action would be more favorable for momentum confirmation.
The primary indicators for traders remain support retention, resistance breakouts, and derivatives activity changes. Any drop below $0.00000474 would negate the visible recovery pattern, while a confirmed move above $0.00000523 would strengthen the short-term recovery pattern. There is no certainty that either will happen and the charts provided are not real-time prices.