
- XRP network activity reached a two-month high with 49,929 active addresses recorded over a 24-hour period.
- Three-month average XRP whale inflows to Binance fell to their lowest level since 2021, signaling weaker selling pressure.
- XRP remains below its 50-day and 200-day moving averages, with $1 as support and $1.07-$1.10 as a key recovery zone.
XRP is testing the $1 level as market negativity reaches a three-month extreme, while network activity rises. Santiment Intelligence reported 49,929 active addresses over 24 hours, the highest level in more than two months. Meanwhile, Darkforst said three-month average XRP whale inflows to Binance fell to their lowest level since 2021.
Network Activity Rises
Santiment said XRP commentary turned increasingly bearish across X, Reddit, Telegram, and other crypto channels this week. The shift came as XRP failed to rally and its market value fell below $1.
However, XRP Ledger activity increased sharply after earlier July levels approached 2026 lows. Santiment recorded 49,929 active addresses during one 24-hour period. The supplied chart also shows daily active addresses near 20.4K, while holders rose steadily to about 8.05 million.
Binance Whale Inflows Fall
Darkforst reported that XRP whale inflows to Binance fell to $61 million on the latest reading. The figure uses a three-month average to track the trend. For comparison, whale inflows reached $456 million in January 2025 and $355 million in October.
Current inflows are six to eight times below those earlier levels. Despite lower inflows, netflows remain positive at about $18.8 million. Darkforst said inflows still exceed outflows on Binance.
The analyst also noted declining inflows and volumes across the market. Darkforst described the pattern as sell-side exhaustion while demand has yet to increase.
XRP Remains Below Key Averages
The chart shows XRP at about $1.001 on August 15, after a medium-term decline from February. XRP traded mainly between $1.35 and $1.55 before the decline accelerated in late May and June.
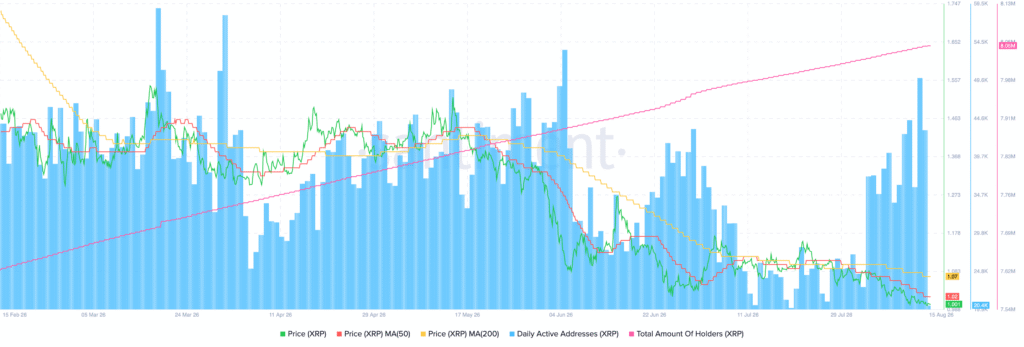
Price then moved toward $1.05 to $1.10, forming lower highs and lower lows. The 50-day moving average is near $1.02, while the 200-day average is around $1.07. XRP remains below both averages, while the 50-day average also sits below the 200-day average.
The $1 level is immediate psychological support. The chart places resistance near $1.02, $1.07, and $1.10 to $1.18. It identifies $1.07 to $1.10 as the key recovery zone.