

- Analyst warns ZEC could fall another 50–70% after its reported 10,500% two-year rally, maintaining a bearish outlook below $1,699.
- Ardi identifies $1,370 as the key breakout level, with a move above it potentially opening 1,500–1,700.
- ZEC consolidates near 1,250–1,260, with support at $1,160 and $1,100; losing $1,100 could expose further downside.
Zcash faces competing price forecasts ahead of its NU7 mainnet upgrade, expected around November 5–6. Analyst Crypto Patel warned that ZEC could correct another 50–70% after its reported 10,500% two-year rally. Meanwhile, analyst Ardi identified $1,370 as the immediate breakout level separating a potential recovery from further downside.
NU7 Upgrade Raises Sell-the-News Concerns
Crypto Patel questioned whether traders had already priced in the upcoming upgrade. The analyst said ZEC’s rally reflected a completed “buy the rumor” trade and warned of a possible correction.
Patel’s bearish outlook remains valid unless ZEC reaches a new all-time high above $1,699. The analyst also requires a confirmed higher-timeframe close above that price before changing the outlook.
Ardi, however, is watching a different technical setup. The analyst identified an ascending triangle developing from the $1,050 lows. Buyers have repeatedly defended the neckline area associated with a potential macro head-and-shoulders pattern.
$1,370 Breakout Could Change Ardi’s Position
ZEC has made several attempts to break $1,370 while holding its rising trendline. Ardi said a breakout could trigger a squeeze toward recent highs between $1,500 and $1,700. The analyst disclosed a short position from $1,420. However, Ardi plans to close those shorts and turn long if ZEC breaks above $1,370.
Without that breakout, Ardi expects the broader downtrend to continue. A breakdown below the trendline and $1,210 support could expose $1,100. Losing that neckline area could send ZEC toward liquidity around its previous cycle high.
ZEC Chart Shows Consolidation After September Rally
The November 2 chart places ZEC around 1,250–1,260, following its September peak near $1,650. Price climbed from roughly $500 in August, then retreated toward 1,100–1,200 during October.
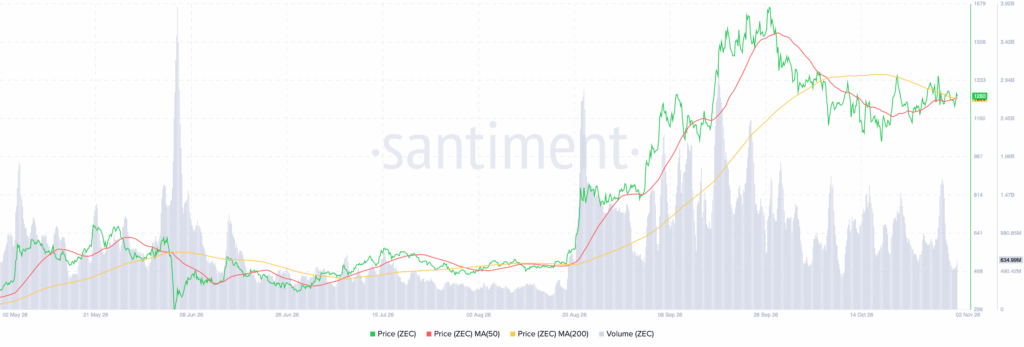
The 50-day and 200-day moving averages have converged near current prices. Trading volume reached spikes above $2 billion during the rally, including one near $3.92 billion. The latest reading stood around $634.99 million.
The chart identifies 1,300–1,350 as resistance, with support at $1,160 and $1,100. A break above resistance could expose $1,500 and $1,650. A loss of $1,100 could open further downside.