

- Michael van de Poppe expects LINK to exceed $20 in Q1 2027, citing a completed liquidity sweep near $10.60 and weekly bullish divergences.
- Giannis Andreou identifies resistance at $14–18, $22–24, $27–32 and $38–40 before his $50 target.
- Short-term indicators remain bearish, with RSI at 45.63 and MACD below its signal line; immediate resistance sits at $11.80–12.00.
Chainlink trades near $11.33 after its late-October rebound failed, as analysts assess recovery targets between $20 and $50. Michael van de Poppe expects LINK to move above $20 in the first quarter of 2027. Giannis Andreou also mapped several resistance zones LINK must clear before reaching his $50 objective.
LINK’s Weekly Structure Shapes the $20 Forecast
Van de Poppe said LINK had corrected 35% from its September high and appeared to be forming a bottom. He cited a rally from $7 to $16 after June, alongside weekly bullish divergences on MACD and RSI.
The September move to $16 also swept the November 2025 high. Van de Poppe said price then moved lower to clear the $10.60 low. He considers that sweep complete and views a weekly close above $10.60 as evidence of buying pressure. His target stands above $20 in Q1 2027.
Andreou Maps Four Barriers on the Way to $50
Andreou said LINK was testing weekly demand between $10 and $12, including the 0.786 Fibonacci retracement near $10.56. He identified 14–18 as the first recovery barrier, followed by supply at 22–24 and macro resistance between $27 and $32.
Beyond those zones, Andreou listed 38–40 as another checkpoint. Historical supply between $48 and $53 contains his $50 objective. From the cited reference price of $11.801, a move to $50 would represent a hypothetical 323.69% increase. He said the route requires confirmed weekly breakouts and successful retests. If demand fails, 7–9 becomes the major base.
LINK’s Short-Term Indicators Remain Bearish
The November 2 Binance four-hour chart showed LINK at $11.331, down 0.21%. Price had fallen from about $15.50 in late September, making lower highs and lows. A sharp October 29 sell-off briefly pushed LINK toward $10.60 before a rebound reached $11.90.
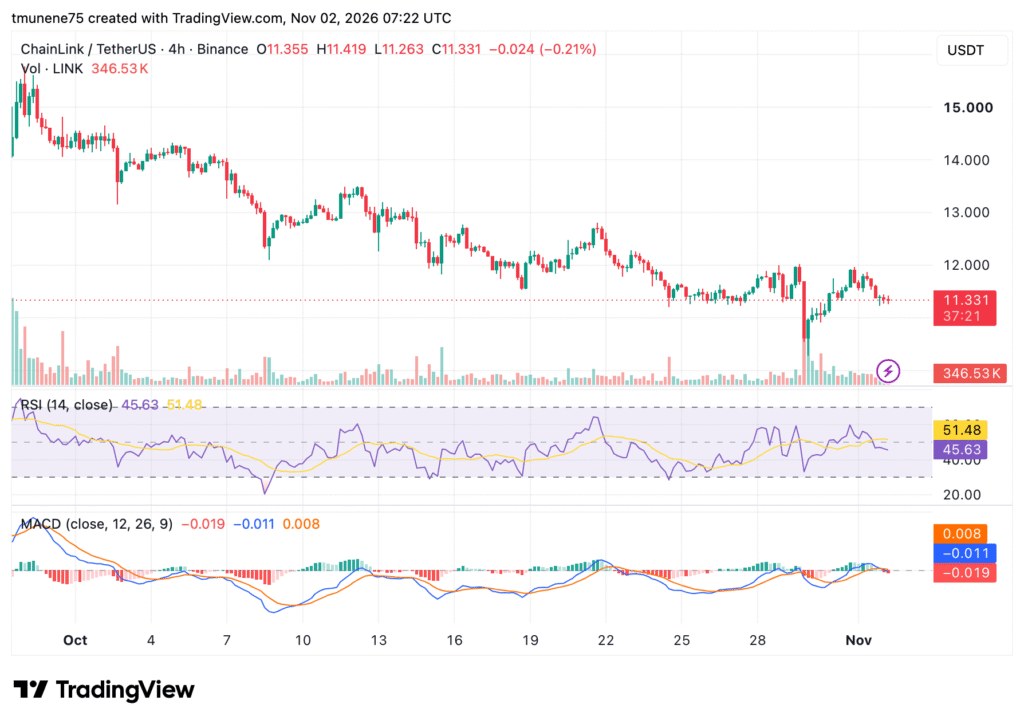
Volume rose during that decline, but price later retreated. The RSI stood at 45.63, below its 51.48 moving average. The MACD line was -0.011, below the 0.008 signal line, while its histogram measured -0.019. The chart placed support at 11.00–11.30, then $10.60 and $10.00. Resistance stood at 11.80–12.00, followed by $12.50.