

- Analyst historical correction model places Ethereum’s potential bottom between $846 and $1,300, although $1,510 may already be the cycle low.
- Ethereum’s four-hour MACD turned bullish, with its histogram reaching 5.68, while RSI recovered to 41.52.
- ETH faces immediate resistance at $1,700 and $1,800, while $1,650 and $1,600 remain key support levels.
Ethereum is attempting a short-term recovery near $1,668, even as its broader trend remains bearish. Analyst Crypto Patel projects a possible bottom between $846 and $1,300 using historical corrections. However, the latest Binance four-hour chart shows improving momentum, while ETH remains below several important recovery levels.
Crypto Patel Calculates Ethereum’s Next Potential Bottom
Crypto Patel compared Ethereum’s previous all-time-high corrections to estimate its next potential bottom. The declines reached 72.45% in 2016, 94.33% in 2018 and 81.92% in 2021. The 2025–2026 correction reached 69.51% at the June low.
Previous cycles recorded an average decline of 82.90% and a median of 81.92%. Using the August 2025 peak of $4,954, Crypto Patel’s average model places the next bottom near $846. The median model produces a higher estimate of $1,300.
However, Crypto Patel said Ethereum’s June 2026 low around $1,510 could already represent its macro bottom. A further decline toward 850–900 remains a historical possibility, not a certainty.
The analyst outlined three potential targets for Ethereum’s next all-time high. The conservative range stands at 5,500–6,000, while the base case reaches 6,000–8,900. The aggressive scenario extends from $9,000 to $11,000.
Crypto Patel identified Q4 2026 through Q1 2027 for further bottom observation. The next major all-time-high window falls in May–June 2029.
ETH Chart Shows Recovery Above $1,650
Meanwhile, Ethereum traded at $1,668.13 on November 22, according to the four-hour Binance chart. Its latest candle gained 0.09%, opening at $1,665.06 before closing at its $1,668.13 high.
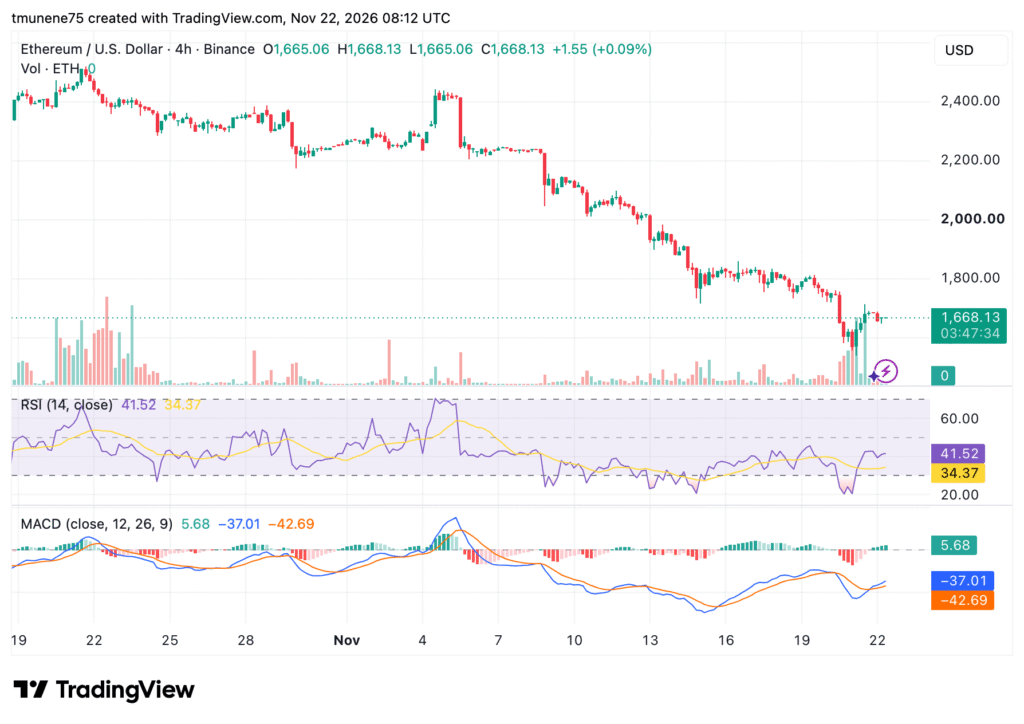
ETH has declined from approximately $2,450 since late October. The November 5 selloff accelerated losses below $2,200, $2,000 and $1,800. Recent candles show recovery around 1,650–1,700, alongside increased trading activity.
RSI and MACD Show Improving Momentum
The RSI stands at 41.52, above its moving average of 34.37. However, it remains below 50 despite recovering from oversold territory. The MACD line also climbed above its signal line, reaching -37.01 against -42.69.
Its histogram turned positive at 5.68, although both lines remain below zero. Ethereum faces immediate support at $1,650 and $1,600. Resistance is at $1,700, followed by $1,800 and $1,900.
A sustained break above $1,800 would strengthen the recovery, while rejection near $1,700 could renew selling pressure. Crypto Patel said market structure, ETH/BTC strength and on-chain confirmation should take priority over historical averages.