
- Egrag identifies $1.45 and $1.65 as key range boundaries, with a C-wave scenario below $1.45.
- XRP recovered from around $1.05 to above $1.50 in August, reversing an extended decline.
- XRP held above the $1.42 200-day average while facing immediate resistance around 1.53–1.55.
XRP is holding near $1.50 after a sharp recovery, while analyst Egrag Crypto sees $1.45 and $1.65 as key range boundaries. Egrag said XRP remains inside a smaller range within its broader structure. Chart data shows consolidation after the August surge, with XRP trading around $1.501 on September 30.
Egrag Keeps XRP Inside A Narrow Range
According to Egrag Crypto, XRP remains between $1.45 and $1.65 until price closes outside either level. He described $1.45 as the range low and $1.65 as the range high. However, Egrag said his ABC scenario remains active unless XRP closes above $1.65.
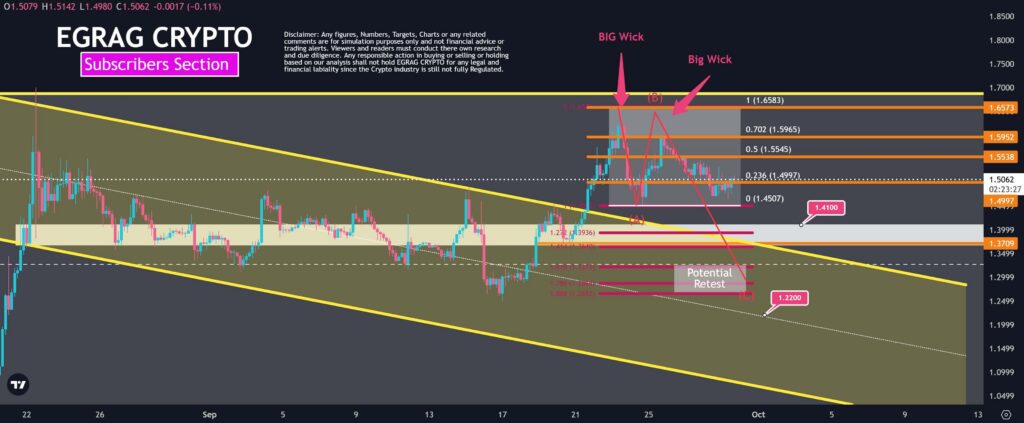
He also said the B wave could extend higher. If the C-leg develops, he mapped potential downside levels at $1.41, $1.37, $1.32, $1.28 and $1.22.
Egrag also said he would consider accumulating XRP again if the price reaches $1.30 or lower. For long-term holders, he described the 1.45-1.65 area as an accumulation zone.
XRP Recovered After A Long Decline
The chart shows XRP falling from roughly 1.35-1.45 between late March and early July 2026. The decline took the token near $1.00 in late June or early July. During that period, the 50-day moving average fell below the 200-day moving average.
That setup accompanied the extended decline before the trend changed in late August. XRP then climbed from about $1.05 to above $1.50 in a sharp move. Daily Active Addresses also spiked during the rally, reaching several hundred thousand. One reading reached about 938,000.
Key Levels Are Near $1.42 And $1.55
After reaching roughly 1.55-1.60, XRP entered a volatile consolidation phase. On September 30, the price stood near $1.501. Meanwhile, the 50-day moving average was around $1.53, while the 200-day average stood near $1.42.
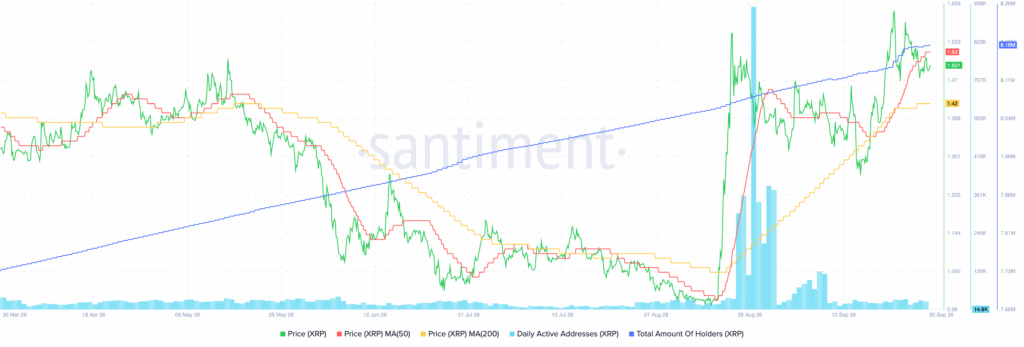
XRP traded below its shorter-term average but above its longer-term average. The holder count also increased, ending near 8.18 million from roughly 7.66 million. The chart identifies $1.42 as longer-term support and 1.53-1.55 as immediate resistance.
A move above $1.55 could reopen the 1.60-1.63 area. A break below $1.42 would weaken the recovery structure.