
- SUI’s previous golden crosses preceded rallies above 220%, fueling a potential $4 target.
- Snyder watches $1.10 support and a possible move toward $1.33 if Bitcoin maintains its uptrend.
- SUI consolidates near $1.16 as RSI and MACD point to cooling short-term momentum.
SUI is approaching a potential golden cross as its 50-day simple moving average nears a move above the 200-day average. Analyst Ali Charts says the setup could precede a rally toward $4, based on previous crossover patterns. Meanwhile, Lennaert Snyder is tracking shorter-term price levels, including $1.33, as SUI consolidates around $1.16.
Ali Charts Tracks Previous Golden Cross Rallies
According to Ali Charts, SUI is nearing a new golden cross, a technical pattern formed when the 50-day SMA crosses above the 200-day SMA. The analyst identified previous golden crosses in December 2023 and October 2024.
Those crossovers preceded rallies of approximately 240.25% and 222.45%, respectively. Ali Charts estimates that a similar 230% advance could take SUI toward $4 if the pattern repeats.
The current setup follows SUI’s recovery from around 0.68–0.70 in mid-September. The token climbed above $1.00 before reaching approximately 1.25–1.30 between September 18 and 22.
Snyder Watches $1.10 Retest and $1.33 Target
Lennaert Snyder highlighted SUI’s reaction to the $1.10 level, which he had identified as a 50% retracement level. Three days after that assessment, SUI retested the area with limited downside movement.
Snyder suggested that traders holding long positions consider taking 25% profits and placing stops below the $1.10 low. He set a $1.33 target, conditional on Bitcoin maintaining its local uptrend.
However, Snyder is also watching Bitcoin’s potential move toward $82,000. If that occurs, he identified $1.03 as a previous range-high retest for possible continuation longs.
SUI Consolidates as Momentum Cools
SUI was trading at $1.1607, with its latest four-hour candle gaining 1.12%. After retreating from around 1.27–1.28 toward $1.10, the token stabilized near $1.16. Immediate resistance is at $1.20, followed by the 1.25–1.30 zone. Support remains at $1.10, while 1.00–1.05 forms a broader structural area.
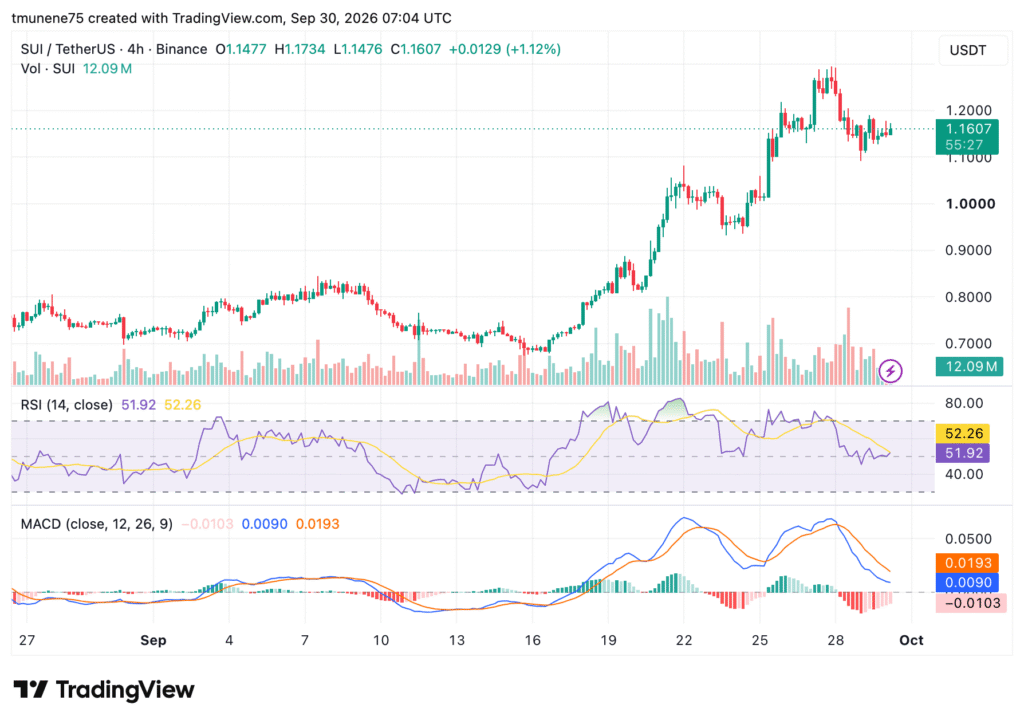
Trading volume stood at approximately 12.09 million SUI, below the larger spikes during the rally. The RSI was 51.92, slightly under its 52.26 average, while the MACD read -0.0103 against a 0.0193 signal line. The displayed MACD histogram was also -0.0103, reflecting weaker short-term momentum.