
- XLM’s pending setup places its next two-week close at the center of attention as price approaches a major long-term technical area.
- Recent price action shows a recovery from September lows toward $0.22, while buyers continue defending the broader rebound structure.
- Long-term indicators now point toward a potential transition after months of weakness, with confirmation depending on the upcoming candle.
XLM buy signal expectations are rising as the two-week candle approaches its closing point. Price has recovered sharply from September lows and now trades near $0.22. The setup keeps the long-term moving average firmly within focus.
Two-Week Chart Approaches a Key Confirmation
Jesse Olson recently pointed to a pending buy signal on XLM’s two-week chart. His post noted that the current candle should close within two days. The setup therefore depends heavily on how the candle finishes.
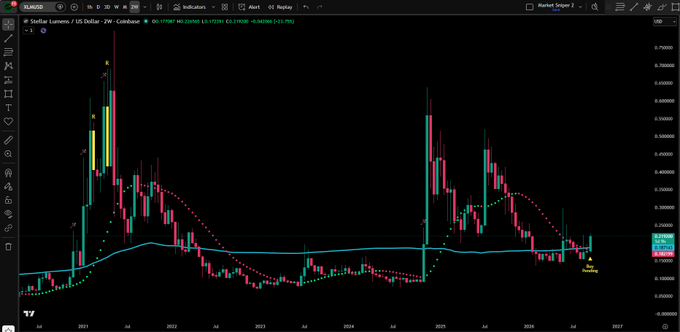
The broader chart shows several major cycles across XLM’s trading history. A strong expansion appeared during 2021 before an extended correction followed. Price then spent years moving around much lower levels.
That long consolidation eventually preceded another substantial advance during late 2024. XLM accelerated higher again during early 2025 before reaching above $0.60. The subsequent decline returned price toward its longer-term trend structure.
The current setup therefore appears near an established technical reference. The cyan moving average has repeatedly interacted with XLM across different market phases. Price is now approaching that same line after months of weakness.
Price Recovers Toward the $0.22 Resistance Zone
XLM has recently recovered from a September low near $0.17. CoinGecko data shows September 17 closing around $0.1834 before subsequent gains. By September 25, the recorded close reached approximately $0.2202.
That recovery came with several sharp daily movements across September. XLM gained more than 7% on September 24, according to Investing.com data. The following session reached an intraday high near $0.2264.
The latest chart places immediate resistance around the 0.2175-0.220 region. Price has already tested that area several times during the recent recovery. A sustained move beyond it would create another technical reference above current levels.
In the short term, the $0.214 level continues to be a support area. The latest intraday chart shows XLM recovering after testing that lower region. Holding above support keeps the current rebound structure intact.
Long-Term Structure Leaves Confirmation Pending
The red dotted indicator has historically shifted with major directional changes. During stronger advances, the dots generally moved below XLM’s candles. During declines, they appeared above the price structure.
The current configuration suggests another potential transition may be developing. However, the supplied analysis identifies the signal as pending rather than confirmed. The upcoming two-week close therefore remains the central technical event.
Recent market data also places XLM around $0.22, following substantial September volatility. CoinGecko recorded a September 23 close near $0.2021 before the subsequent recovery. That move shows how quickly sentiment has shifted within the current range.
The chart does not establish whether another powerful rally will follow. Instead, it shows improving price action around a historically important technical area. The upcoming candle close should determine whether the pending setup becomes an active signal.