
- Analyst warns XRP could fall to 1.18–1.20 if the price breaks below $1.25, before a potential bullish reversal.
- XRP trades near $1.41, with resistance at 1.42–1.45 and support around 1.35–1.38 on the four-hour chart.
- XRP’s RSI remains below 50, while a positive MACD histogram signals fading bearish momentum but does not confirm a recovery.
XRP faces a possible short-term decline toward 1.18–1.20 before a potential recovery toward $1.80, according to analyst Egrag Crypto. His daily-chart roadmap identifies $1.25 as a possible breakdown level, while the 1.30–1.45 range remains important for consolidation. Meanwhile, four-hour market data shows XRP trading near $1.41 amid mixed momentum indicators.
Egrag Crypto Sets XRP’s Downside and Recovery Levels
Egrag Crypto is tracking a yellow fractal formation that suggests further corrective movement before a possible bullish reversal. His short-term outlook places XRP’s consolidation range between $1.30 and $1.45.
A breakdown below $1.25 could expose the 1.18–1.20 zone, which the analyst identifies as a major reversal area. However, he said the scenario would require reassessment if XRP falls below $1.18.
If the token reverses, Egrag Crypto identifies successive upside targets at $1.50, $1.63, and $1.80. He also highlighted the 100 EMA and macro trendlines as important technical references, describing the macro trend as bullish and the shorter-term picture as bearish.
XRP Trades Below Key Resistance on the Four-Hour Chart
XRP traded at $1.4082 on the Binance XRP/USDT four-hour chart, down 0.32% on the latest candle. Trading volume stood at 3.55 million XRP.
The token climbed to approximately 1.62–1.65 around September 23–24 before losing momentum. Selling pressure intensified around October 7–9, pushing XRP toward $1.34 before a recovery toward $1.41.
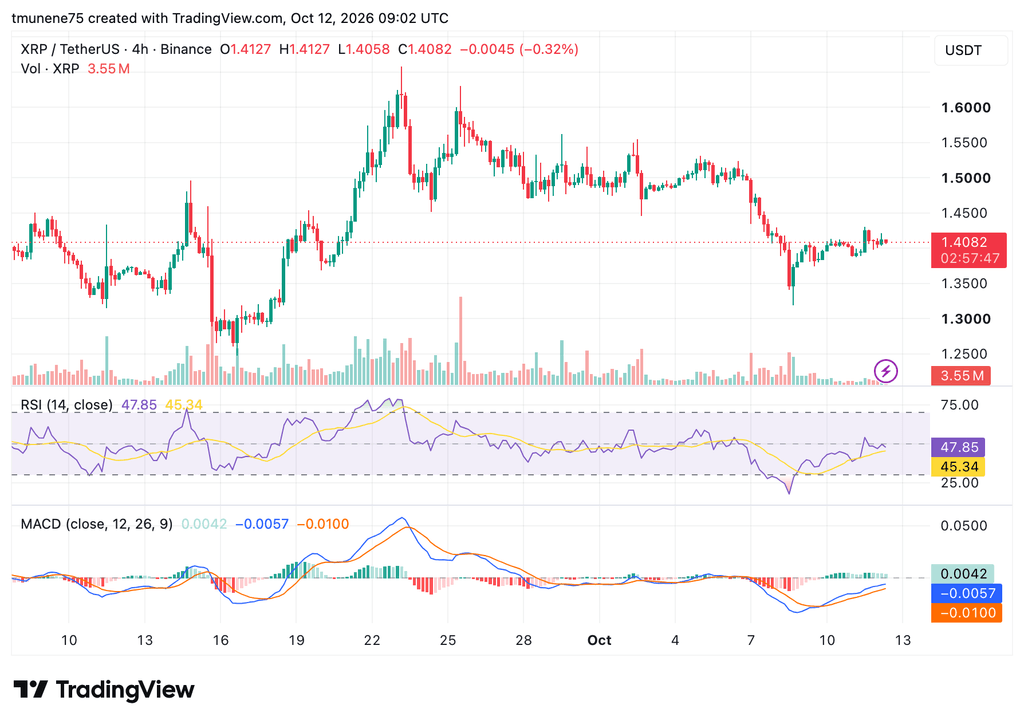
Immediate resistance stands at 1.42–1.45, followed by 1.48–1.50. Support sits around 1.38–1.35, with stronger support near $1.30.
Momentum Indicators Show Mixed Signals
The Relative Strength Index stands at 47.85, above its moving average of 45.34. However, the RSI remains below 50, indicating that bullish momentum has not firmly established itself.
Meanwhile, the MACD histogram has turned positive at 0.0042. The MACD line remains negative at -0.0057, while the signal line sits at -0.0100.
This configuration suggests fading bearish momentum and a developing bullish crossover, although sustained price gains remain unconfirmed. A break above $1.45 could open a move toward $1.50, while rejection could expose support near $1.35.