
- Analyst identifies Bitcoin’s $80,500 capital-weighted cost basis as key support, warning that uncertainty around this level could increase selling activity.
- Bitcoin’s Seller Exhaustion indicator has entered a zone resembling previous local tops, signaling potentially elevated selling pressure among short-term holders.
- BTC trades near $82,900 below its 50-day moving average at $84,000 but above its 200-day average at $81,800, leaving key support near $82,000.
Bitcoin faces rising selling pressure after rebounding above $85,000, according to analyst Darkfost, while its price remains near important cost-basis levels. His analysis identifies a potential increase in short-term selling pressure and compares current conditions with previous local market tops. Meanwhile, Bitcoin’s October 11 chart shows weakening short-term momentum as the price trades below its 50-day moving average.
Bitcoin Tests Its Capital-Weighted Cost Basis
Darkfost said Bitcoin is following a pattern similar to late 2025 and early 2026. The cryptocurrency is fluctuating around its capital-weighted cost basis, estimated at $80,500. Unlike realized price, this measure weights investors’ cost basis by the amount of capital invested.
Consequently, the level helps identify where investors collectively stand between profit and loss. Darkfost described this zone as a support level that continues to hold. However, he noted that uncertainty around the level encourages investors to become more active.
Bitcoin’s chart shows the price recovering from approximately 59,000–61,000 in late May and early June. It then consolidated between roughly $60,000 and $65,000 through July and mid-August.
Seller Exhaustion Indicator Points to Higher Pressure
However, Darkfost also reported that Bitcoin’s selling pressure had intensified. His Seller Exhaustion indicator combines supply in profit with volatility, measured through returns, to identify periods of elevated or reduced risk.
The indicator focuses on hypothetical selling pressure rather than actual realized selling. Following Bitcoin’s rebound above $85,000, it entered a zone comparable to levels associated with local tops during the current cycle.
Darkfost noted that short-term holders, or STHs, showed a particularly sudden change. He added that volatility declines over time, making the indicator’s underlying dynamics more relevant than individual readings.
Bitcoin Trades Below Its 50-Day Average
Meanwhile, Bitcoin surged above $76,000 around August 18, accompanied by higher trading volume. The rally continued through September, when prices reached approximately 86,000–87,000.
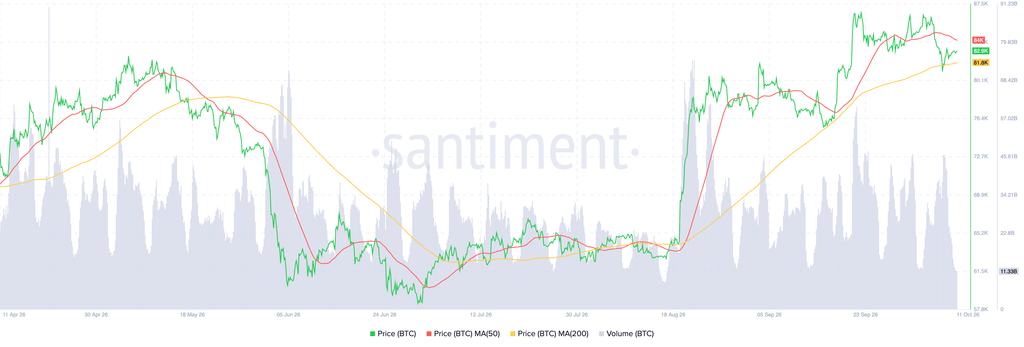
By October 11, Bitcoin had retreated to around $82,900. Its 50-day moving average stood near $84,000, while its 200-day average remained around $81,800. Bitcoin therefore trades below its 50-day average but above its rising 200-day average.
The chart places immediate support around 81,800–82,000, with lower support near 79,000–80,000. Darkfost said demand would need to contain potential selling pressure for volatility to compress and the indicator to normalize.