
- Elliott Wave projections allow for another drop in price to $9.49 or lower before LINK may start to continue the big up move.
- Futures liquidations reveal repeated leverage flushes, with June and August recording sharp spikes among long and short positions.
- LINK’s declining structure faces resistance around $12, while Fibonacci levels provide potential support during an extended correction.
Chainlink price outlook remains cautious as LINK faces renewed selling pressure, with Elliott Wave projections allowing another corrective decline before recovery attempts gain traction.
Elliott Wave Structure Leaves Room for Another Decline
More Crypto Online recently discussed LINK’s ongoing correction through an Elliott Wave perspective. The analyst suggested additional downside remains acceptable within wave B or wave 2. This interpretation allows the correction to extend without immediately cancelling the broader bullish structure.
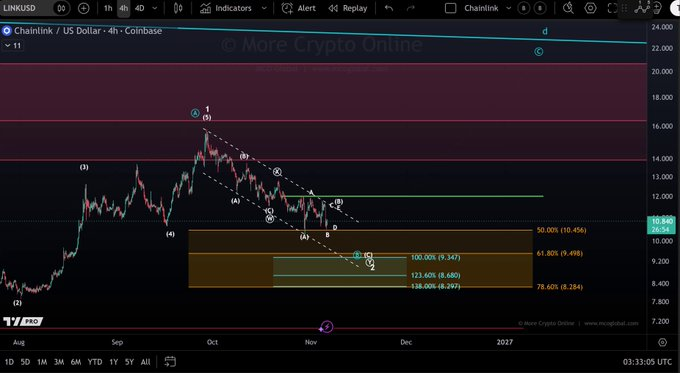
LINK previously advanced from August lows around $8 before reaching approximately $16. That rally established the peak from which the current corrective movement developed. Since October, successive lower highs have kept prices beneath descending resistance.
The four-hour chart presents two possible interpretations of the ongoing decline. LINK might be finishing wave 2 following an initial impulsive push. The move may also be the B wave of the bigger corrective formation.
In both scenarios there is room for further weakness prior to the next phase of rising. Hence, the current downside turn is not a stand-alone bearish turn. But buyers must get more positive price action to confirm either bullish interpretation.
Fibonacci Levels Identify Potential Support Areas
The Fibonacci retracement measurements provide several reference points for monitoring LINK’s correction. The 50% retracement level is located near $10.456, which is close to the current trading area. A sustained break beneath this area could expose deeper support.
The next significant level is the 61.8% retracement period at $9.498. This level could attract attention if sellers maintain control. The chart also identifies extended downside references around $9.347 and $8.680.
Further weakness could bring the $8.297 target into consideration. Meanwhile, the 78.6% retracement sits near $8.284. These levels place the potential correction close to August’s trading range.
On the recovery side, descending trendline resistance remains an important obstacle. The green horizontal resistance area around $12 provides another reference. A sustained move above both areas would improve LINK’s technical position.
Liquidations and Recent Price Action Show Market Pressure
The market data places LINK at $10.74, following a 6.67% decline over 24 hours. Its price previously traded near $11.50 before experiencing a sharp intraday breakdown. Subsequent rebounds struggled to maintain positions above $10.90.
Trading volume reached approximately $409 million, representing a 9.35% increase. Rising turnover during a declining session points to increased trading activity. Meanwhile, the price continues fluctuating between approximately $10.55 and $10.90.
The perpetual futures liquidation chart provides further context about leveraged positioning. June recorded long liquidation spikes exceeding $4 million, with one approaching $6 million. August later produced a short liquidation spike approaching $8.35 million.
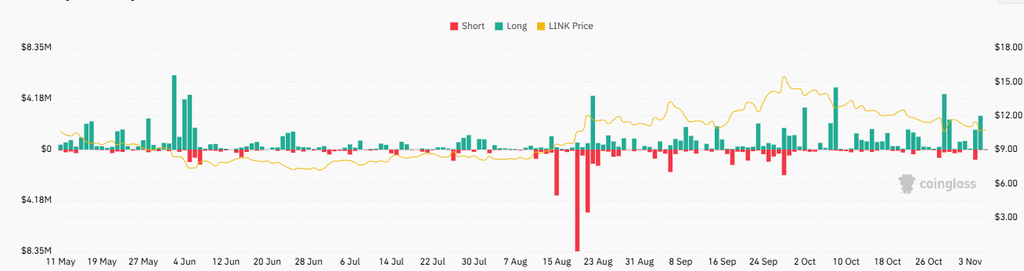
September and October also recorded several long liquidation events above $4 million. These movements accompanied LINK’s rally toward $15 and subsequent retreat. Further selling could expose leveraged buyers to additional forced position closures.
The $10.50 area remains an immediate support reference for traders. A breakdown could bring the lower Fibonacci targets into focus. Conversely, reclaiming $12 would provide stronger evidence of improving market conditions