

- Bitcoin risks falling toward $60,000 if it breaks below the analyst’s $73,000 mid-range support.
- Ethereum faces a potential decline to $1,963 after breaking below its $2,385 chart support.
- XRP could fall toward $0.99 after losing its channel midpoint, while its 22.68% decline exceeds BTC and ETH losses.
Bitcoin, Ethereum and XRP face further downside if selling continues, according to analyst Ali Charts. His analysis places Bitcoin’s key levels near $73,000 and $60,000. Ali Charts outlined these levels amid continued selling; Bitcoin trades near $75,771, down 11.13% over the displayed period.
Analyst Maps Further Declines for Three Assets
Ali Charts said Bitcoin is trading inside a channel on the three-day chart. He identified $73,000 as its mid-range support. If BTC loses that level, he is watching the channel’s lower boundary near $60,000.
Ethereum has already broken below a pattern, according to the analyst. On the daily chart, ETH fell out of a right-angled ascending broadening formation after losing support at $2,385. Ali Charts said continued selling could take the price toward $1,963. XRP has also broken below the middle of its trading channel.
The analyst identified the lower boundary near $0.99 as its next potential support. He cautioned that these levels are not guaranteed bottoms and said prices could reverse quickly. He is watching whether buyers defend the identified areas.
Bitcoin Holds Above $75,000 After Recent Sell-Off
The Bitcoin chart covers October 7 through November 8, 2026. BTC recently traded around $75,771.39, gaining $123.03, or 0.16%, in the latest candle.
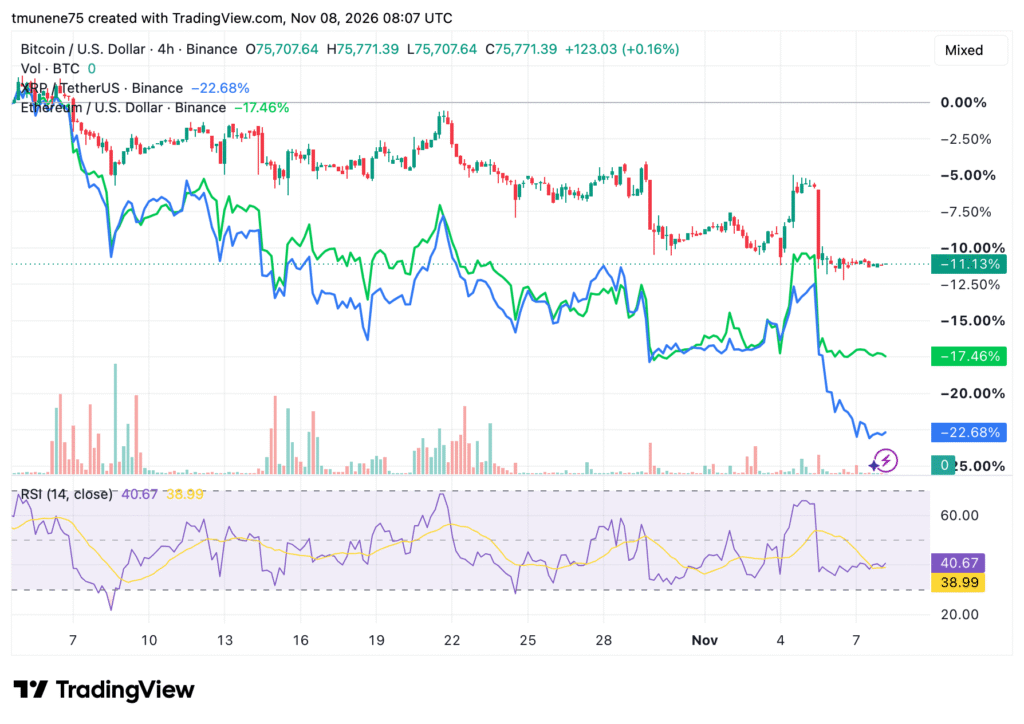
However, its performance remained negative, with an 11.13% decline from the chart’s reference baseline. Bitcoin saw sharp volatility in early October, followed by repeated recovery attempts.
Between October 21 and October 29, price struggled to sustain gains. A brief rebound toward the negative 5% region around November 4 preceded another sell-off toward negative 11%. Trading then narrowed as Bitcoin consolidated.
Bitcoin Outperforms Ethereum and XRP
The comparison shows Bitcoin down 11.13%, while Ethereum lost 17.46%. XRP recorded the steepest decline among the three, falling 22.68%. Bitcoin’s RSI stood at 40.67, compared with its moving average near 38.99.
Although below the neutral 50 level, RSI remained above 30. The reading places Bitcoin outside deeply oversold territory. Its RSI also sat slightly above its average, while the broader chart continued to show negative performance.