

- A weekly Bitcoin loss exceeding 15% would mark only the 45th occurrence in its history, representing 5.2% of weekly periods.
- Bitcoin’s MVRV score fell below 1.2, triggering a market-bottom alert for the third time during the current bear market.
- BTC trades near $64,031, with RSI at 21.03 and negative MACD momentum as support levels at $64,000, $62,000, and $60,000 come into focus.
Bitcoin faces a weekly loss exceeding 15% as analyst Darkfost highlights a rare decline and a fresh MVRV alert. If the loss holds through the weekly close, it will become the 45th weekly drop of that size in Bitcoin’s history. Meanwhile, BTC trades near $64,031 on November 15, with four-hour indicators showing heavy selling pressure.
Bitcoin’s Weekly Decline Ranks Among Rare Events
Darkfost said the weekly correction has exceeded 15%. The last comparable decline occurred four years ago. Such weekly losses account for just 5.2% of Bitcoin’s history.
The analyst also reported that Bitcoin’s MVRV score triggered a market-bottom alert hours earlier. Darkfost said readings below 1.2 have historically marked market bottoms. Before this bear market, the last occurrence came in 2022, when BTC traded between $16,000 and $21,000.
MVRV Alert Returns For a Third Time
Darkfost said the alert has now appeared three times during this bear market. The first came in February, when Bitcoin had just crossed $60,000. The second occurred between June and July, when BTC reached $57,000.
He said dollar-cost averaging at current levels seems reasonable. MVRV compares Bitcoin’s market capitalization with its realized capitalization. Realized capitalization values each unspent transaction output, or UTXO, at the price of its last movement.
High readings can indicate overvaluation and unrealized profits that may create selling pressure. Low readings can indicate undervaluation. Darkfost said the alert adjusts over time to account for MVRV’s long-term decline.
Bitcoin’s Chart Retains a Bearish Structure
Bitcoin fell from approximately $84,000 in mid-October to $64,031.19 on November 15. Around November 13, it dropped below $72,000 and then $68,000. The latest four-hour candle gained 0.24%, or $152.40, but lower highs and lower lows remain.
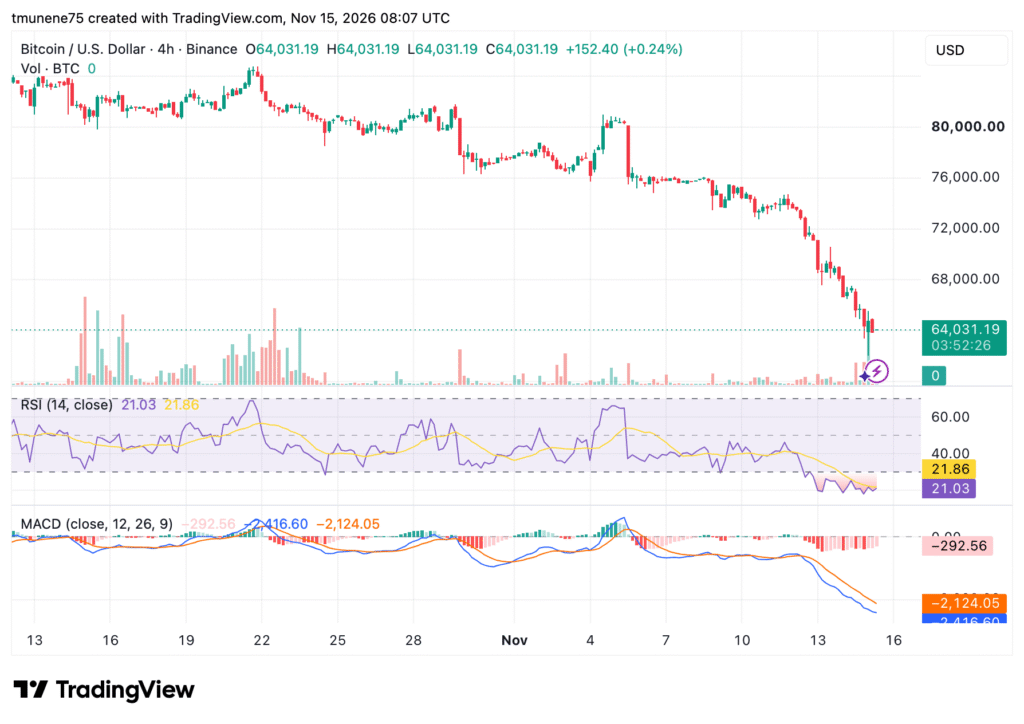
Displayed trading volume was zero. The RSI stood at 21.03, below the 30 oversold threshold. Its moving average read 21.86. MACD remained negative, with its line at -2,416.60 below the signal line at -2,124.05.
The histogram stood at -292.56. Bitcoin faces immediate support near $64,000, followed by $62,000 and $60,000. Recovery hurdles stand at $68,000 and $72,000.