
- Ethereum gained 60.62% in Q3, recovering from $1,530-$1,550 to around $2,520 after a strong late-August rally.
- Ali Charts sees a potential $3,000 target if ETH breaks its developing triangle, echoing a previous 31% breakout.
- ETH remains above its 50-day and 200-day averages, while $2,460-$2,493 support and $2,585 resistance shape the outlook.
Ethereum has gained 60.62% in Q3 2026, recovering from earlier losses and trading near $2,500. Analysts Ali Charts, Crypto Patel, and Michael van de Poppe have highlighted renewed strength in ETH. Their analysis points to a possible move toward $3,000, with support levels and a developing triangle pattern shaping their outlook.
ETH Rebounds After Sharp Second-Quarter Decline
Ethereum fell from above $2,300 in April to approximately $1,530–$1,550 in late June. The cryptocurrency then recovered through July and early August, forming higher highs and higher lows.
Notably, ETH broke above a key range around Aug. 22. The price later climbed from approximately $1,900 to above $2,450 during a sharp late-August rally. Trading volume increased substantially during that move.
ETH subsequently consolidated at higher levels and now trades near $2,520. According to Crypto Patel, Ethereum reached $2,665 before settling near $2,500. Patel also noted that ETH recently outperformed Bitcoin after recording its quarterly gain.
Analysts Identify $3,000 as the Next Target
Ali Charts said Ethereum’s previous triangle breakout produced a 31% gain within three days. He added that another triangle is now forming on the ETH chart.
According to Ali Charts, a similar breakout could send Ethereum toward $3,000. His analysis focuses on the potential price movement following a break above the developing pattern.
Meanwhile, Michael van de Poppe identified a retest around $2,460 after Ethereum’s recent breakout. He said the level must hold as support for his projected move toward $3,000 to remain relevant.
Ethereum Holds Above Major Moving Averages
Ethereum’s 50-day moving average is near $2,493, while its 200-day moving average is around $2,331. The current price remains above both averages, with the 50-day average above the 200-day average. The 200-day average has also started rising.
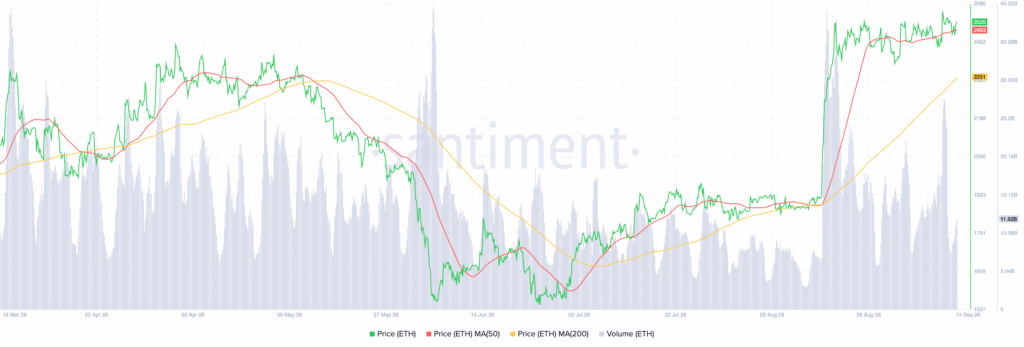
Meanwhile, the chart places immediate resistance near $2,585, close to the upper boundary of the recent range. A sustained move above $2,493 would preserve the current bullish structure. However, a break below that level could expose Ethereum to support near $2,331.