
- LINK reached $10.558 after breaking $10, with analysts targeting $11, $11.50, $13.50 and $17.
- The 50-day average near $9.32 moved above the 200-day average near $8.60 as LINK gained momentum.
- Van de Poppe favors buying dips below $9.20, while $10.80-$10.90 remains the next major resistance zone.
Chainlink (LINK) has moved above $10 as analyst Michael van de Poppe says its bear market has ended. He points to a sweep of earlier lows and bullish divergences behind the move. LINK reached $10.558, while rising volume and moving averages support the stronger price structure described in the analysis.
LINK Clears $10 Resistance
Van de Poppe said LINK swept $10, with $10.03 identified as a lower-timeframe level. He prefers a long entry below $9.20 if price revisits that area after the $10.03 sweep. He said the dip does not need to occur for the broader setup to continue.
His next target after $10 is $11, while wider targets sit at $11.50, $13.50 and $17. The analyst also said LINK’s higher-timeframe structure has started a bull market. He described LINK as trending higher after clearing $10.
Volume And Moving Averages Strengthen
The chart shows LINK trading near $8 to $10 from February through May. It then reached about $10.80 before a June decline pushed the price toward $7.10. From late June, LINK formed higher lows and recovered the $8.00 to $8.60 area.
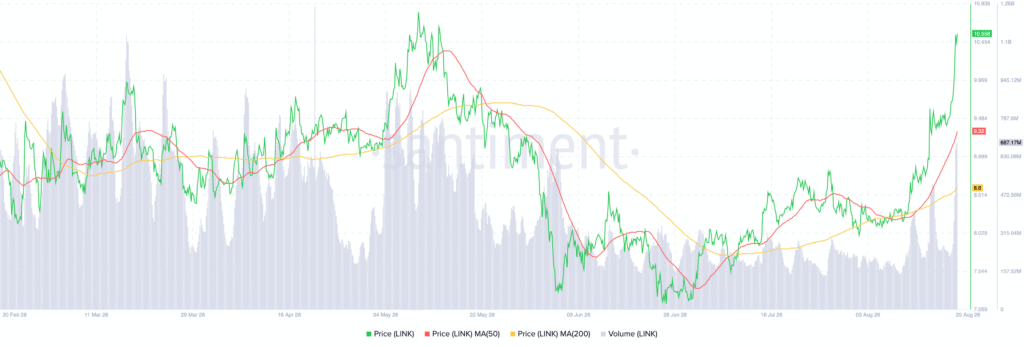
By August, the token broke above that range and accelerated toward $10.558. Notably, the 50-day moving average stands near $9.32, while the 200-day average sits around $8.60.
LINK trades above both averages, and the 50-day average has turned upward. Volume also expanded sharply during the latest advance. The increase accompanied the move above the prior consolidation range.
LINK Faces The Next Resistance Zone
The $10.45 to $10.60 area now forms the immediate breakout zone. Above it, the previous $10.80 to $10.90 high remains the next resistance area. A move above $10.90 would place the $11 region next on the levels outlined.
However, rejection near $10.80 to $10.90 could bring profit-taking into focus. The chart identifies $9.32 as the first dynamic support level. The $8.60 area then provides another moving-average support zone.
Van de Poppe said he views buying dips as the preferred approach, particularly below $9.20. He also described the current setup as continuing to show strength across higher and lower timeframes.