
- SHIB price recovers after early weakness, with buyers defending higher levels across the latest session and restoring upward momentum.
- Rising trading volume accompanies the rebound, while support near $0.0000052 remains central to the latest price recovery structure.
- The chart shows a potential base forming, while sustained strength requires continued defense of the highlighted support zone now.
SHIB price is recovering after prolonged weakness, with the latest chart showing stronger demand, rising activity, and a developing base near key support as buyers defend elevated levels.
A Potential Bottoming Structure Emerges
The latest structure shows a sharp recovery after an extended period of declining prices. Price moved toward a long-established support area before attempting a broader reversal. The chart therefore places greater attention on support retention and subsequent upward movement.
Whales Care frames this structure as a potential bottoming zone for SHIB. The post states the bottom is in and a massive pump is loading. That view centers on accumulation near support rather than another isolated short-term bounce.
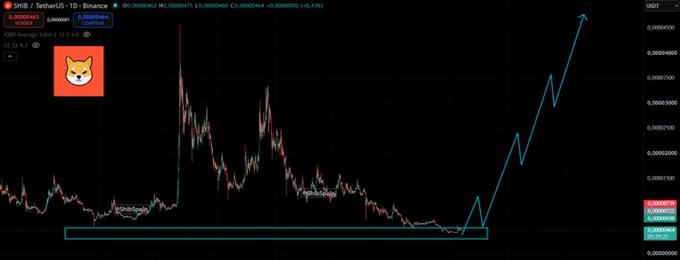
The chart’s turquoise rectangle marks the zone where buyers have repeatedly defended price. Price reached this area after a prolonged sequence of lower highs and lower lows. Holding that region remains central to the bullish structure presented by the chart.
The projected path also shows several advances separated by temporary pullbacks. That pattern would create higher highs while maintaining progressively stronger trading levels. The projection points toward a sustained expansion rather than one immediate vertical move.
Recent Trading Shows Renewed Buying Activity
The latest chart records a price near $0.000005285, up 4.23% over 24 hours. Trading volume is currently close to $78.12m with a 25.64% daily rise. That combination accompanies the rebound and shows stronger activity during the latest session.
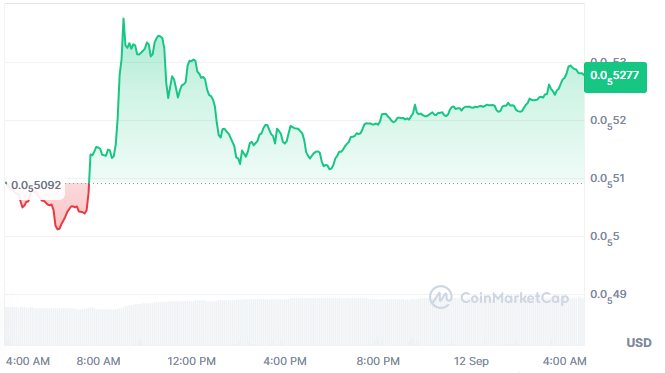
The session initially moved lower, reaching the area around $0.00000509. Buyers then entered aggressively, producing a sharp advance around the morning period. The move carried price above $0.0000052 before a corrective phase developed.
After the initial spike, price pulled back and formed several intraday swings. However, the decline did not return fully toward the session’s starting levels. Instead, price stabilized and gradually recovered through the afternoon and evening.
The later chart action shows a sequence of higher levels developing across the session. Price eventually moved back toward the upper boundary near $0.000005285. This recovery places attention on whether buyers can maintain those elevated trading levels.
$0.0000052 Remains a Key Reference
The $0.0000052 area has become an important reference within the recent recovery. Price moved above that level after the morning surge and later consolidated nearby. A sustained hold would preserve the stronger structure visible across the latter session.
The earlier historical chart adds broader context to the current support formation. Several previous rallies were followed by deep retracements and prolonged downward movement. The latest base therefore sits beneath a much longer corrective price structure.
Market data also reveals a capitalization of around $3.11 billion. Circulating supply is around 589.23 trillion tokens, and over 3.08 million tokens are held. Volume-to-market capitalization currently sits around 2.5%, according to the displayed figures.
The chart’s bullish projection depends on continued support and upward follow-through. A move beyond recent highs would extend the sequence of higher trading levels. A return below the support area would weaken the structure shown in the analysis.