
- Altcoin open interest excluding Ethereum remains above Bitcoin’s, with Ted warning that elevated leverage could trigger widespread liquidations.
- Seven-day cumulative altcoin inflow transactions have reached one of their highest levels in months, signaling rising exchange activity.
- The mid- and small-cap market holds near $203B, with $205B resistance and $200B support shaping the next move.
Altcoin markets face renewed selling pressure as leverage remains elevated and more tokens move onto exchanges. Analyst Ted said altcoin open interest, excluding Ethereum, still exceeds Bitcoin’s open interest. Meanwhile, analyst Maartunn reported that seven-day cumulative inflow transactions reached one of their highest levels in months.
Altcoin Open Interest Remains Above Bitcoin
According to Ted, altcoins excluding ETH hold more open interest than Bitcoin. Ted said altcoins carry “decent leverage” and expects many positions to be wiped out within a few weeks. His comments focused on exposure held in altcoin derivatives.
However, Ted did not provide exact open interest figures or identify specific tokens facing the highest exposure. Maartunn reported that altcoins are moving onto exchanges again. He added that seven-day cumulative inflow transactions have surged to one of their highest levels in months.
However, the figures provided do not show the total value of transferred tokens or identify the exchanges involved. The inflow data appeared alongside Ted’s comments about derivatives leverage. Ted focused on open interest, while Maartunn examined exchange transactions.
Mid- and Small-Cap Market Cap Tests $205B
The crypto total market cap excluding the top 10 cryptocurrencies stood near $203.10 billion on the one-hour chart. Market capitalization rose above $212.5 billion around Sept. 7 and neared $214 billion again on Sept. 9. It then declined toward the $198 billion to $200 billion area before recovering.
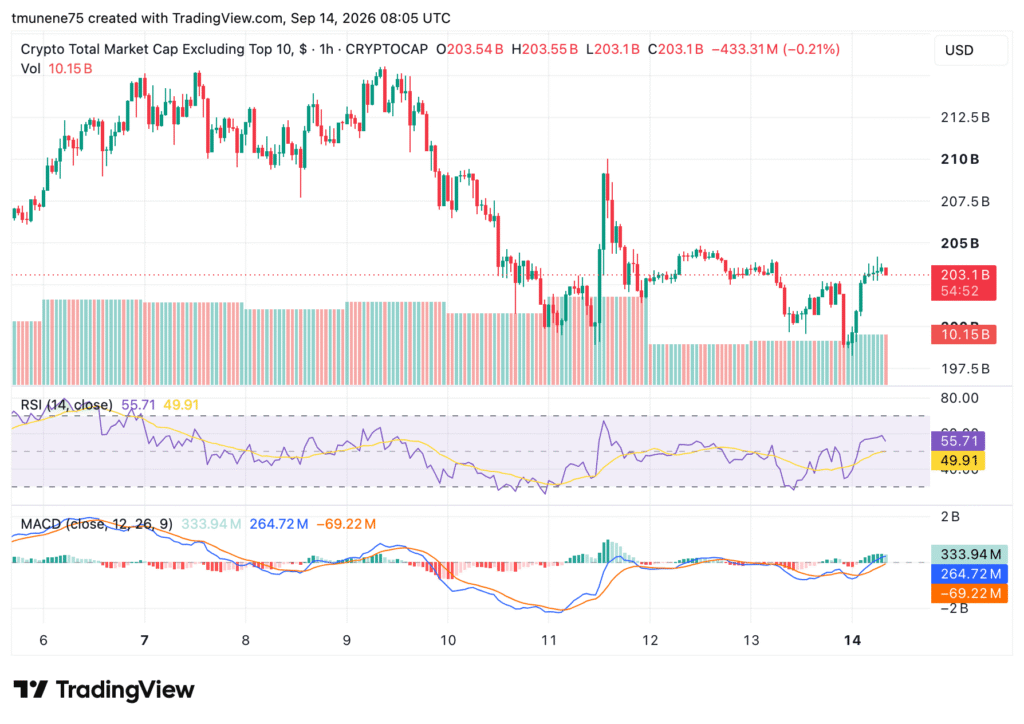
The recovery has since flattened near $203 billion. The chart places $205 billion as immediate resistance, followed by $207.5 billion to $210 billion. Support appears at $200 billion, with stronger support near $197.5 billion to $198 billion.
The RSI stood at 55.71, above its moving average at 49.91. The MACD histogram was positive at $333.94 million, while the MACD line reached $264.72 million against a signal line at negative $69.22 million.