
Key Insights
- LUNA remains below the $0.0741 Fibonacci resistance, keeping short-term structure bearish despite stabilization above the $0.0657 support level.
- Open interest surged above $30 million before dropping sharply, highlighting aggressive speculative cycles shaping recent LUNA price swings.
- Spot inflows briefly exceeded $5 million in December, triggering a rally that quickly reversed as traders locked in profits.
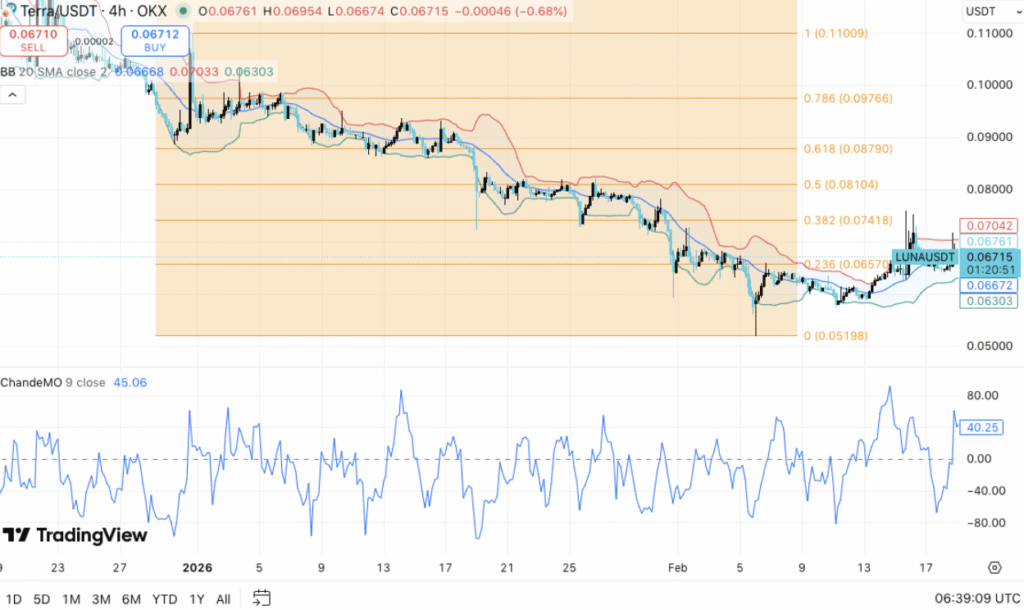
Terra token LUNA continues to trade under pressure on the 4-hour chart as buyers attempt to steady price action near critical Fibonacci levels. The token remains below the 0.382 retracement at $0.0741, even after rebounding from the $0.0519 macro base. Consequently, the broader structure still reflects a pattern of lower highs and lower lows since the January peak near $0.1100.
LUNA now tests the 0.236 Fibonacci level around $0.0657, which has shifted into near-term support. However, sellers continue to defend the $0.0741 resistance zone, preventing a clear shift in short-term momentum. A decisive move above this barrier could open the path toward $0.0810 and then $0.0879, where the 0.618 retracement marks a key reversal threshold.
Bollinger Bands Signal Rising Price Expansion
The 4-hour Bollinger Bands have widened after a prolonged compression phase, signaling renewed volatility. Additionally, the Chande Momentum Oscillator holds near +40, showing moderate buying pressure without extreme conviction. Hence, price action reflects cautious accumulation rather than aggressive trend reversal.

If LUNA loses the $0.0657 level, traders will likely shift focus to the $0.0600 to $0.0580 demand zone. Moreover, sustained selling below $0.0580 would expose the $0.0519 macro base once again. Sellers still control the broader channel, and recovery attempts must overcome layered resistance between $0.0741 and $0.0810.
Derivatives Data Highlights Rapid Position Cycling
Open interest trends show repeated cycles of sharp expansion followed by rapid deleveraging. Positioning earlier ranged between $3 million and $6 million before spiking above $15 million during late November rallies. Significantly, recent activity pushed open interest beyond $30 million before cooling toward $8 million, underscoring speculative bursts that continue to influence short-term swings.
Spot market flows reveal extended distribution from April through October, with steady outflows weighing on price stability. However, early November brought intermittent inflows that supported brief stabilization. A strong mid-December inflow exceeding $5 million triggered a rally, yet profit-taking quickly erased much of those gains, leaving flows near neutral since January.
LUNA trades within a defined range where Fibonacci resistance caps upside attempts and support levels hold immediate risk. Moreover, expanding volatility and shifting leverage patterns suggest that traders now watch for confirmation above $0.0741 or renewed weakness below $0.0657 to define the next directional move.