
- XRP fell below $1.40 and tested $1.34-$1.35 as buyers attempted to stabilize the decline.
- Ali Charts sees $1.70 as the next target, while Egrag Crypto tracks $1.65 before a potential move toward $1.80.
- RSI and MACD remain bearish, keeping $1.35 and $1.34 as key downside levels until XRP reclaims $1.40.
XRP has cleared a resistance level, according to Ali Charts, who placed $1.70 as the next target. Meanwhile, Egrag Crypto is tracking $1.65 as a key level before targeting $1.80. XRP traded at $1.3639 on Aug. 31, while its latest price action showed continued pressure below $1.40.
Ali Sets $1.70 XRP Target
Ali Charts reported that XRP had confirmed a breakout and cleared resistance. He identified $1.70 as the next target for the cryptocurrency. However, the latest chart data shows XRP trading below that level after a sharp decline.
Price moved from the $1.50-$1.55 region into a series of lower highs. XRP briefly recovered toward $1.46-$1.47 on Aug. 27. However, sellers rejected the move, and XRP later fell below the $1.40 psychological level.
The decline accelerated on Aug. 31, pushing XRP toward $1.34-$1.35. Buyers then attempted to stabilize price around that area.
Egrag Tracks $1.15 Support
Egrag Crypto outlined a different short-term path for XRP. His tracker places the $1.40 area first, followed by a potential move toward $1.15-$1.20. According to Egrag, XRP could then attempt a recovery toward $1.63-$1.65.
He identified $1.65 as the trigger level for his next upside target. If XRP reclaims $1.65 with strength, Egrag expects $1.80 to become the next major checkpoint. Until then, his tracker keeps the $1.15-$1.20 zone as the main downside area.
Meanwhile, the chart places immediate support around $1.35 and $1.34. A decisive break below those levels could expose additional downside.
XRP Indicators Show Continued Pressure
XRP’s RSI is at 42.08, below its 43.24 moving average. The reading also is below the neutral 50 level. However, RSI has recovered from near-oversold territory. The MACD remains bearish, with a histogram near -0.0034.
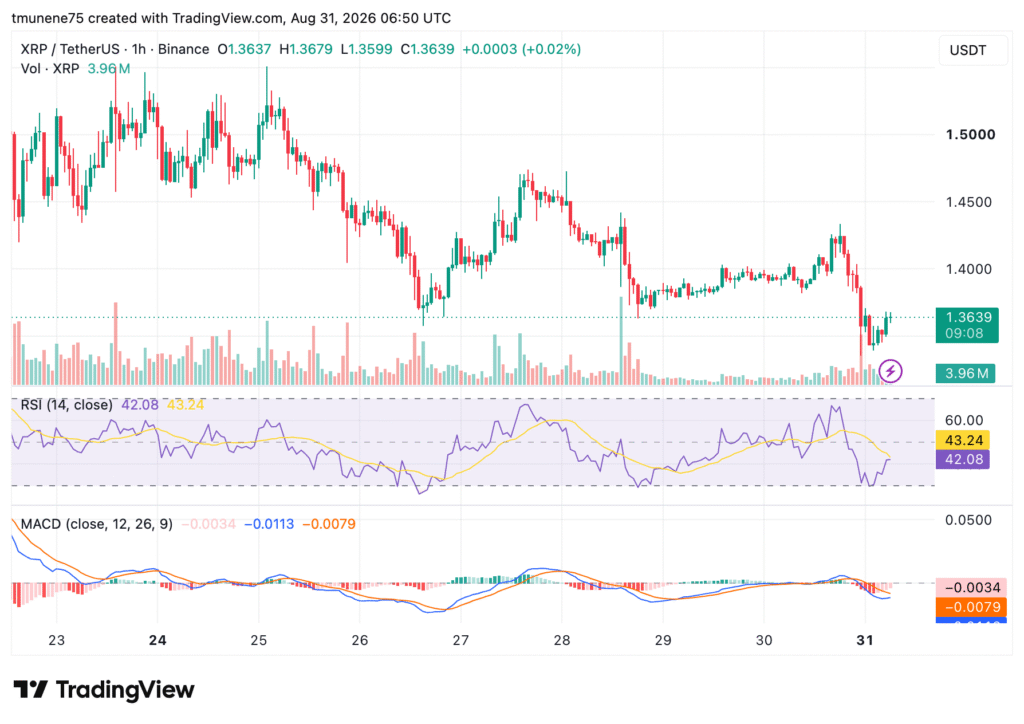
The MACD line is around -0.0113, below the signal line at -0.0079. Meanwhile, resistance appears at $1.40, followed by $1.42-$1.43 and $1.45. A sustained move above $1.40 would improve the short-term structure. However, continued weakness below that level would keep $1.35 and $1.34 in focus.