
- XLM reached all four upside targets before falling toward 0.16–0.17, showing how quickly a profitable trade can turn.
- As prices increased, short liquidations in late-May hit around $10 million, and forced position closures were smaller in later months.
- XLM faces renewed selling pressure after losing its rising trendline, with traders watching nearby support and the former $0.18 breakout level.
XLM has given back most of its earlier advance, returning toward previous lows after a rally that reached four projected targets.
XLM Reaches Four Targets Before Falling Back
Jesse Olson reported that XLM had reached all four upside targets before returning to its earlier lows. His chart showed a buy signal following a break above descending resistance. The rally rewarded the setup, but the gains proved difficult to hold.
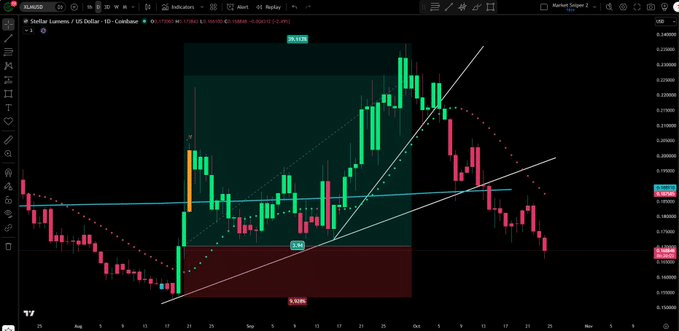
Prior to this breakout, price remained for a long time below a downward trendline. A quick rising trend then crossed above the horizontal level and just above $0.18. That move gave the trade a clear entry point and several higher targets.
The original chart marked successive price zones above the entry. According to the supplied analysis, the move toward the fourth target offered roughly 47% upside. That figure described the projected trade, not a guaranteed return for every position.
Price later climbed toward $0.24 before turning lower. It broke beneath the rising trendline and then slipped below $0.18. Olson’s reminder to take profits addressed what happened after the targets were reached.
Liquidation Data Shows Where Traders Faced Forced Closures
The liquidation chart covers activity from late April through October. Red bars represent short liquidations, while green bars represent long liquidations. An orange line tracks XLM’s price alongside those events.
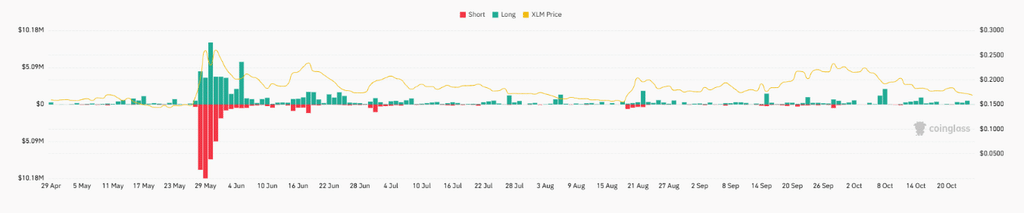
The largest burst appeared around May 28–30, when short liquidations approached $10 million. During the same period, price rose toward 0.25–0.26. The combination points to heavy losses among leveraged traders betting against the advance.
June brought several smaller liquidation spikes as prices continued to fluctuate. By July and early August, the bars stayed much closer to the baseline. Forced closures were less pronounced than during the late-May episode.
Another cluster appeared in late August, when long positions faced liquidations. Smaller bursts followed during September and early October. None approached the scale of the late-May event shown on the chart.
XLM Returns to Support After the Rally Fades
The market data as of writing places XLM at $0.1686, down 1.06% over 24 hours. The supplied market figures also show a weekly decline of 4.47%. Daily trading volume stands at approximately $83.56 million.
Earlier in the session, price dropped toward $0.1668 before buyers stepped in. The rebound carried it above $0.1690 and toward $0.1720. Sellers then took control, sending prices back toward the lower end of the range.
The first level of interest is at $0.1680. Buyers will support it, and price may resume the climb to $0.1690 and possibly $0.1700. If it moves above $0.1700 then the next immediate resistance is in sight.
A break below $0.1680 would leave the earlier low exposed. The chart places that area around 0.1670–0.1668. Another visit would show that buyers had failed to protect the recent floor.
The former breakout level near $0.18 remains well above the current price. It would take a much bigger recovery to reclaim it, than a quick bounce. So far, it’s a simple pattern: four targets were hit, the rally turned around, and most of the gains faded. As with traders in similar situations, Olson’s message is very clear: securing profits is just as important as picking an entry.