
- SUI faces resistance at $0.733 as analyst eyes $0.68-$0.70 if Bitcoin loses recent lows.
- Sui network activity spans DeFi, payments, gaming and stablecoins, highlighting broader use beyond SUI’s price action.
- SUI trades near $0.725 between its 50-day average at $0.747 and 200-day average near $0.71.
SUI is trading below its 50-day moving average after a rejection at $0.733, while network activity remains a focus. Analyst Michael van de Poppe identified $0.68-$0.70 as a possible entry zone if Bitcoin loses recent lows. Meanwhile, Lucky highlighted activity across DeFi, payments, gaming and stablecoins on the Sui network.
SUI Rejection Keeps $0.70 Support in Focus
Van de Poppe said SUI faced a clear rejection at $0.7330, which had turned into resistance. He said the declines were becoming less severe while the broader trend remained under review. If SUI falls further and Bitcoin loses its recent lows, Van de Poppe pointed to $0.68-$0.70.
He also identified $0.90 as a later price level. The current chart places SUI near $0.725, below the 50-day moving average at about $0.747. However, price remains above the 200-day moving average, which is near $0.71.
SUI Network Activity Spans Several Uses
Lucky, Bitcoin OG Since 2015, said users are active across DeFi, payments, gaming and stablecoins. He also highlighted Sui Network’s stablecoin payment infrastructure and its reported usage. The network focus comes alongside a volatile price path.
SUI started the period near $0.90-$0.95 and briefly moved above $1 in April. The token then reached about $1.39 in mid-May before falling below $0.90. By June, SUI had reached the $0.70 area. That decline was followed by a volume-backed rally in mid-August. SUI moved toward about $0.92 before retreating toward $0.70-$0.72.
Moving Averages Frame the Current Setup
The chart shows SUI at approximately $0.725, placing it between the two moving averages. Notably, the 200-day average near $0.71 provides the lower reference level. Trading volume is at about 390.01 million SUI.
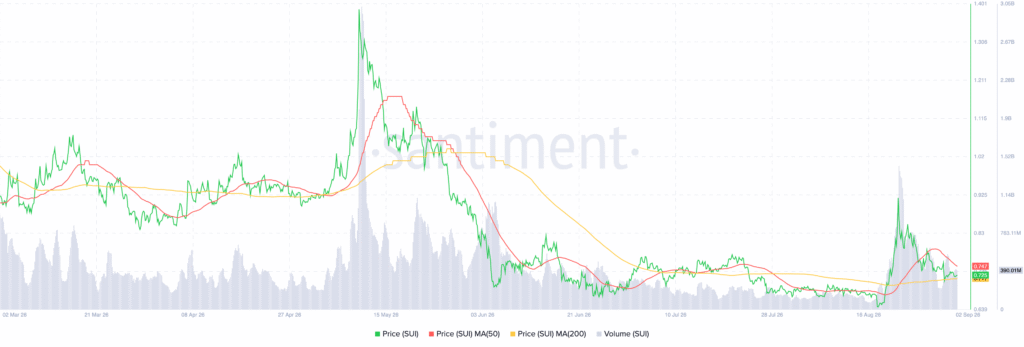
Meanwhile, $0.70-$0.71 remains the support area identified from the chart. A move above $0.747 would bring $0.80-$0.83 into focus on the provided levels. However, a break below $0.70 would expose the $0.64 area.
The price structure also shows repeated selling near higher levels. SUI remains below the $0.7330 level cited by Van de Poppe as resistance.