

- Solana recovered to $72.06 after testing $70, but its broader downtrend remains intact, with immediate support between $69 and $70.
- Michael van de Poppe identified current prices as potential accumulation levels, while Crypto Patel could target $30 if support fails.
- A move above 75-76 could open a test of $80 and $90, while bearish RSI and MACD readings show continued selling pressure.
Solana has rebounded nearly 3% to $72.06 after testing $70, but its broader downtrend remains intact. Analysts Michael van de Poppe and Crypto Patel have outlined different accumulation levels, while four-hour indicators show continued bearish momentum. Their outlooks center on whether support between $69 and $70 can hold.
Analysts Identify Different Levels for SOL Accumulation
Van de Poppe said the gap between Solana and its 21-day moving average has become extreme. He described current prices as potential accumulation levels, although SOL could still sweep its lows.
He also noted that the token had surrendered gains from its previous run. Van de Poppe suggested beginning to accumulate rather than committing all funds immediately. If SOL rebounds, he identified $85 to $90 as resistance.
Crypto Patel said his expected Wave B scenario failed. Instead, SOL moved directly into Wave C and reached $70. He noted that targets stood at $200 to $300 just one month earlier, after SOL crossed $120.
Patel said current support must hold for a possible bullish reversal. If it fails, he is prepared to accumulate Solana near $30. His longer-term targets range from $500 to $1,000.
Four-hour Chart Shows Selling Pressure Persists
SOL traded at $72.06, up $2.09, or 2.99%. The latest candle opened at $69.95, reached $72.31, and dipped to $69.79. Volume stood at 79.88K SOL.
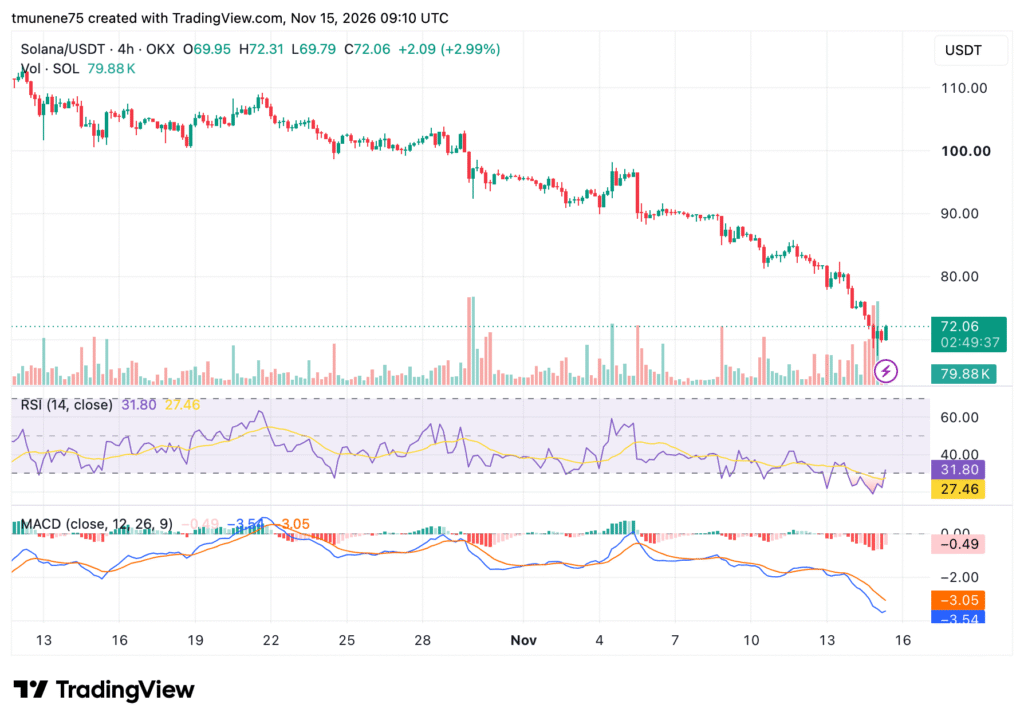
SOL has fallen from approximately $112 on October 12, forming lower highs and lower lows. It also broke below $100, $90, and $80. Immediate support is around $70 to $69, with $65 below. Resistance is at $75 to $76, followed by $80 and $85.
The RSI read 31.80, above its moving average of 27.46, but remained near oversold territory. MACD stayed bearish, with its line at -3.54 below the signal line at -3.05. The histogram stood at -0.49.
A sustained move above $75 to $76 could open a test of $80, while losing $69 to $70 could expose $65. Traders are watching volume, an RSI move above 40, and a bullish MACD crossover.