- Raydium (RAY) is approaching a key $1.45 support level that could spark renewed buying activity and trigger a price recovery.
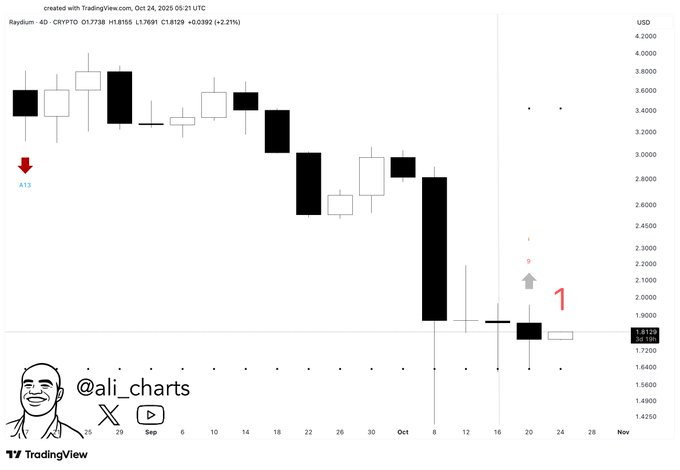
- Analyst Ali (@ali_charts) identifies upside targets at $2.40 and $3.80, marking potential resistance points in Raydium’s recovery path.
- The TD Sequential indicator has printed a buy signal on higher timeframes, signaling possible upward momentum in Raydium’s market structure.
Raydium (RAY) is approaching a critical support zone at $1.45, where analysts suggest a potential rebound may begin. The token currently trades near $1.78, showing signs of weakening momentum after an extended downtrend.
$1.45 Emerges as the Crucial Support Zone
Crypto-analyst Ali (@ali_charts) has indicated that Raydium may find support at $1.45, where a demand zone appears to have developed previously in the last two market cycles. Each time price declined substantially, the market initiated a fast recovery from the $1.45 support. This is another technical area traders will want to pay attention to.
The daily chart indicates that RAY’s price structure is nearing exhaustion. The repeated tests of lower levels suggest that sellers may be losing strength as the token approaches the $1.45 zone. Traders are expected to observe price action closely for bullish candles or increased volume activity once this level is reached.
If the token holds this area successfully, it could establish a solid foundation for a potential recovery phase. This support may also attract renewed buying interest from investors seeking favorable risk-to-reward positions within the current range.
Potential Upside Toward $2.40 and $3.80
Ali’s technical outlook highlights two upside targets of $2.40 and $3.80 should Raydium confirm a bounce from $1.45. The $2.40 price level corresponds with the support zone, now resistance, set in July and early October; this could then be the first significant barrier to upside momentum.
A breakout and daily close above $2.40 will strengthen market confidence and could open the way towards $3.80, the upper boundary of the former trading range. This scenario reflects a full recovery swing, supported by historical price reactions and chart structure.
Traders remain alert for early strength, as RAY may also attempt a direct rebound from current levels if demand accelerates before testing $1.45. However, confirmation of a trend reversal would likely depend on sustained volume and positive candle formations around the support zone.
Technical Indicator Signals Potential Recovery
In a follow-up post, Ali (@ali_charts) noted that the TD Sequential indicator has printed a buy signal for Raydium on higher timeframes. This development suggests that downside momentum may soon ease, setting the stage for a possible upward move.
Traders widely use the TD Sequential to anticipate potential reversal points during extended downtrends. Its appearance on higher charts often marks areas of exhaustion where new trends may emerge.
While the broader trend remains cautious, the confluence of a historical support level at $1.45 and the TD Sequential buy signal strengthens the case for a possible recovery. Market participants are now closely watching Raydium’s reaction in the coming sessions for early signs of a rebound.