
Key Insights
- Hyperliquid’s price dropped toward $39 after repeated failures near $44 strengthened a bearish double top pattern on the daily chart.
- Whale exposure on Hyperliquid reached $4.236 billion as long and short positioning stayed nearly balanced across major traders this week.
- MACD and Aroon indicators weakened further while traders closely watched the important $35 support area for the next directional move.
Hyperliquid extended its decline on Tuesday after another rejection near the $44 resistance zone increased pressure on bullish traders. The HYPE token traded near $39.2, reversing gains from earlier this month when buyers briefly pushed the asset above $44. Despite the retreat, the token still holds above the April support area near $35.
Large traders on the Hyperliquid platform continued showing mixed positioning as volatility returned across the digital asset market. Data showed total whale exposure reached nearly $4.236 billion, while long positions stood close to $2.099 billion, and short exposure climbed slightly higher to around $2.137 billion. Consequently, the long-to-short ratio remained near a balanced 0.98 level.
ETF Launch Supports Sentiment
Investor interest around the Hyperliquid ecosystem remained firm after 21Shares launched the first United States-listed exchange-traded funds tied to the HYPE token. The products include a spot ETF with staking exposure alongside a leveraged fund linked to the decentralized derivatives platform. Additionally, the launch strengthened Hyperliquid’s growing institutional profile within the digital asset sector.

Hyperliquid continued attracting activity across decentralized perpetual futures markets as traders processed billions of dollars in daily volume. The platform also maintained a leading share of decentralized perpetual open interest, highlighting continued demand despite the recent price weakness. However, repeated failures near the $44 to $45 range encouraged some investors to secure profits.
Double Top Pattern Emerges
Technical indicators now point to rising downside risks after HYPE formed a bearish double top structure on the daily chart. The pattern developed after two major peaks appeared near the $44 to $45 resistance area over recent weeks. Significantly, the neckline support currently sits near the $35.2 zone, which buyers defended during April consolidation.
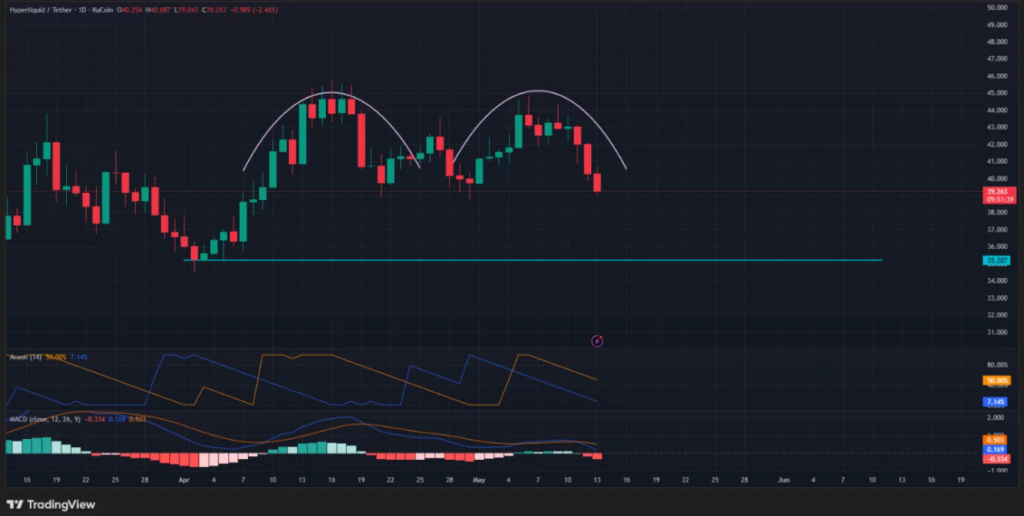
The MACD indicator reinforced the weaker outlook after the MACD line crossed below the signal line while the histogram moved into negative territory. Besides, the Aroon Up indicator declined toward the 50% region as bullish momentum gradually weakened. The Aroon Down indicator remained subdued near 7%, showing sellers have not fully gained trend control.
Market analysts now watch the $35 support level closely as a break below that area could trigger a larger correction toward the $31 to $32 region. However, bulls could regain momentum if HYPE climbs back above the $44 resistance zone. A stronger recovery above that level may reopen the path toward the psychological $50 target.