
- ETH/BTC remains under major moving averages, with resistance between 0.05–0.06 BTC, a breakout above may signal a solid reversal of the trend.
- A bullish divergence on the weekly chart indicates declining bearish momentum, with both RSI and Stochastic RSI flashing signs of possible price reversal.
- ETH/BTC is testing a major historical low, with substantial trading volume implying a fierce battle between sellers and buyers.
Ethereum’s performance against Bitcoin has been on a sustained downtrend, but there is a key technical setup for a reversal of momentum. A massive bullish divergence has been seen on the chart for the week, and this may be a reversal signal or a major bounce.

Downtrend and Key Moving Averages
ETH/BTC has been in a confirmed downtrend since 2022, with lower lows and lower highs. The cryptocurrency has been trading below two key moving averages, the 200-week Moving Average (MA200) and the 200-week Exponential Moving Average (EMA200). These are resistance levels for the long-term, and a sustained crossover above them could be a reversal of the trend. The downside pressure still remains for the moment.
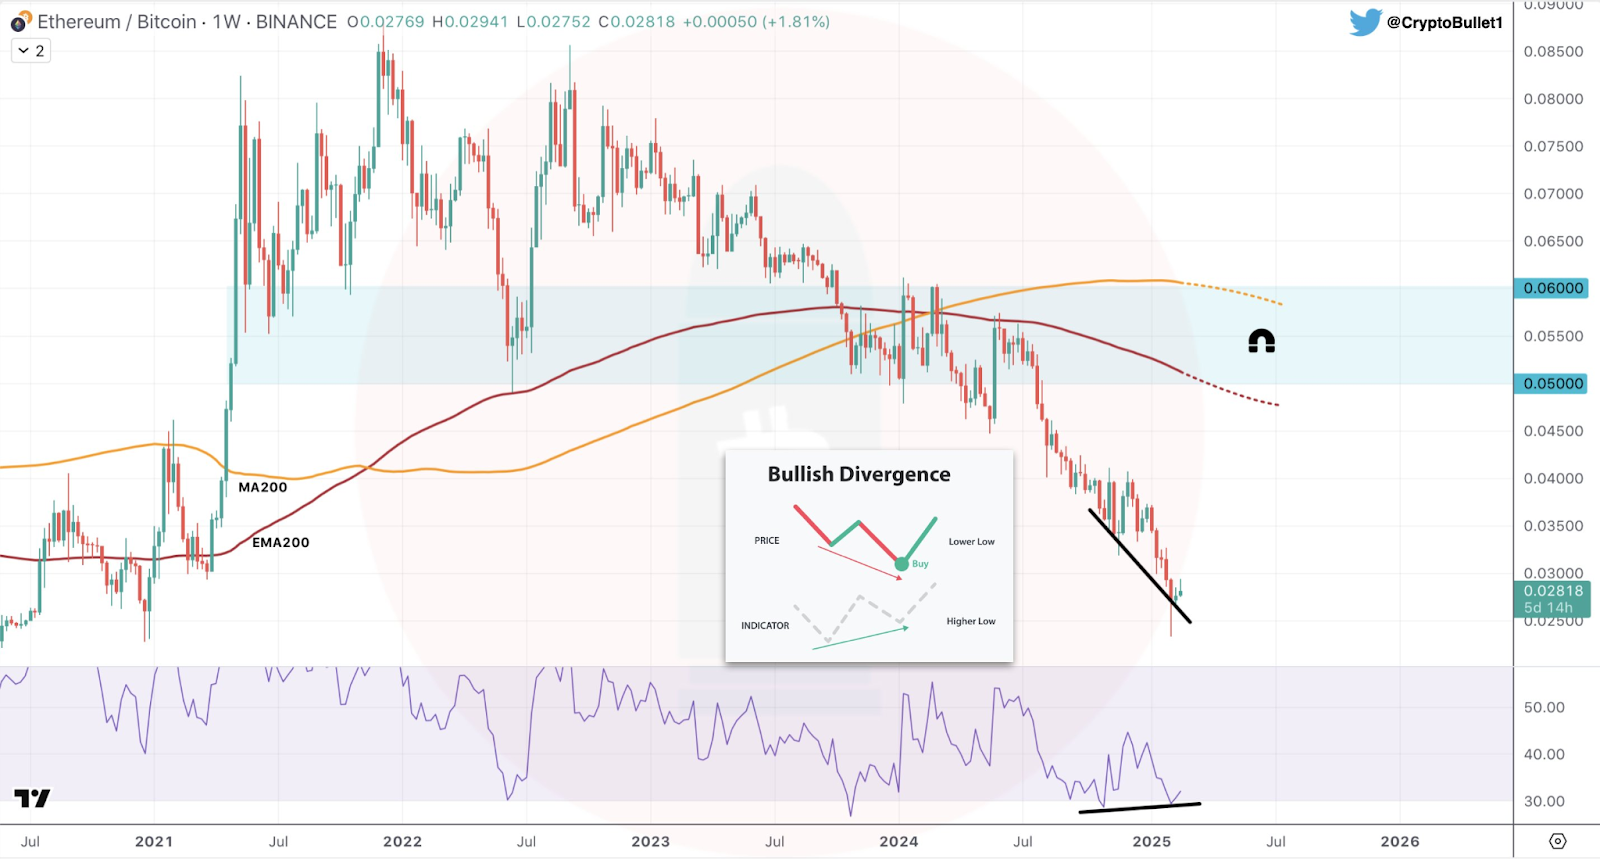
A post from CryptoBullet1 brings this bearish setup into view and suggests there could be a reversal for ETH/BTC if the price can regain momentum and pass above these moving averages. The major resistance point is between 0.05 and 0.06 BTC, where the MA200 and EMA200 converge and form a solid price pocket.
Bullish Divergence and Oversold ConditionsETH/BTC
A notable bullish divergence has been established between the price and the Relative Strength Index (RSI). The lower lows of , on the other hand, has been accompanied with higher lows on the RSI, and this signals decreasing bearish momentum. The reversal pattern, also appearing in anticipation of reversals, signals sellers’ weakening.
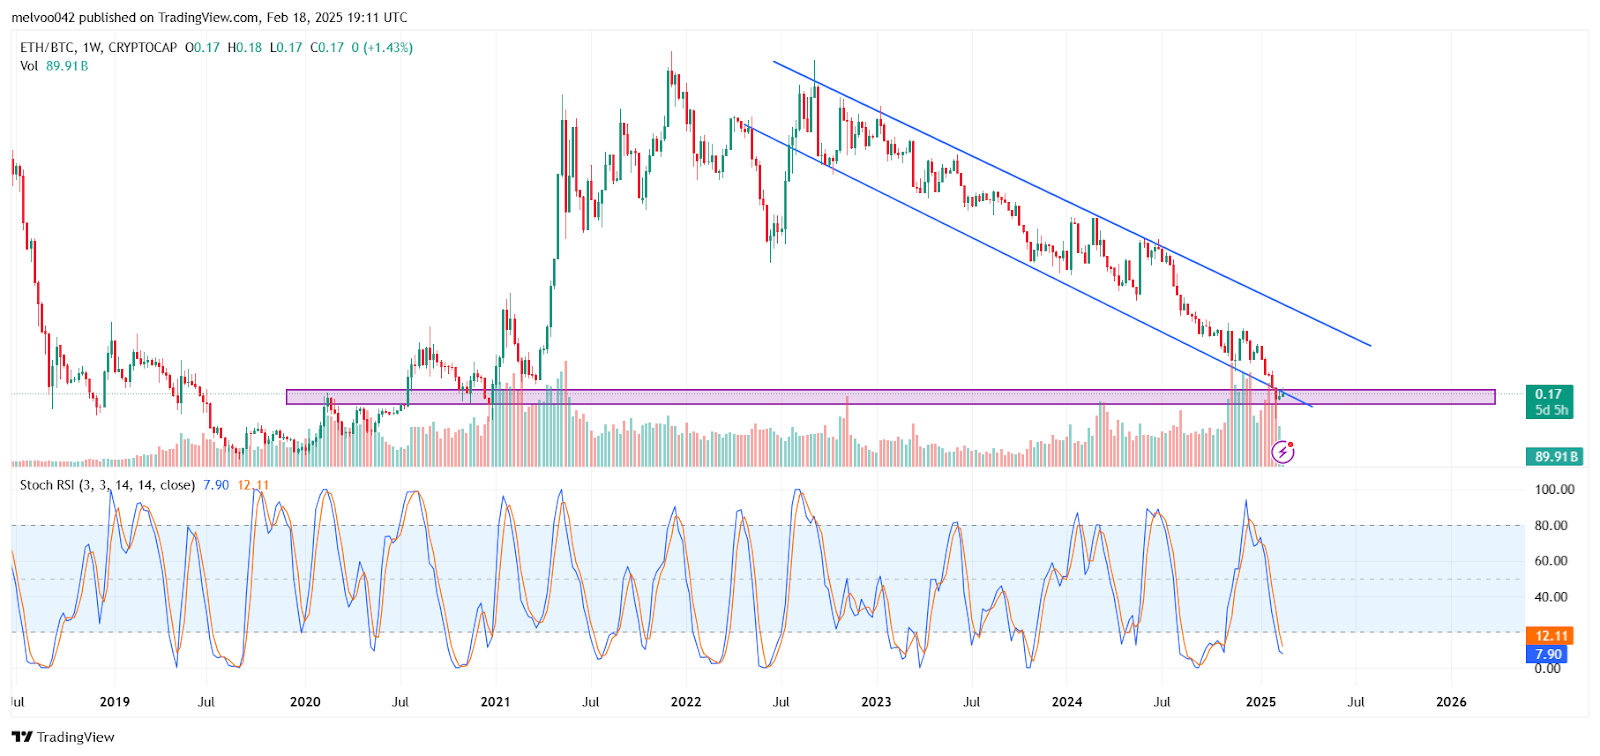
Additionally, the RSI remains under 30, therefore still in the range of being oversold. This creates the possibility of a reversal of the price because there may be buying on such levels. Stochastic RSI also signals extreme levels of being oversold, corroborating the possibility of upward movement.
Major Support Area and Probable Scenarios
ETH/BTC is testing a historically significant point of support. The area had been resistance in the pre-2021 period and has been recently probed for its capacity for support. If the price stays above this point, a breakout from the downtrending channel could be indicative of conviction.
However, if the support fails, more downside can be expected. The traders will be interested in the next weekly close in order to know where the markets are. Volume on major levels on the rise means heavy trading, with sellers and buyers contending for dominance.
ETH/BTC remains in a critical point. The bullish divergence and being in the oversold territory suggest a rebound, but confirmation is needed for a reversal of the trend.