
Key Insights
- Analyst Dan Gambardello links Cardano’s monthly RSI reset and macro liquidity cycles to conditions that previously preceded ADA’s explosive 2020–2021 rally.
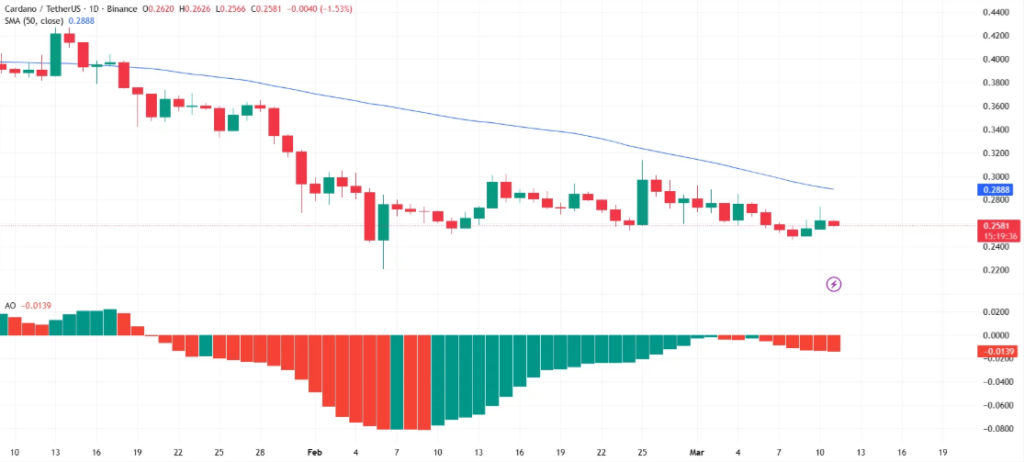
- ADA trades near $0.26 while the $0.288 moving average forms resistance, and the $0.24 to $0.25 zone continues acting as key support.
- Analysts say major altcoins, including Ethereum, Cardano, and Sui, appear technically compressed ahead of potential expansion if macro liquidity improves.
Cardano price action has entered a closely watched phase as analysts highlight macro liquidity indicators that resemble conditions seen before the previous bull market surge. Market observers now track both technical and macro signals as ADA trades near $0.26 following months of correction.
Besides the short-term volatility in crypto markets, analysts increasingly point to liquidity trends tied to monetary policy as an important driver behind long-term price cycles.
Analyst Links Current Setup to Prior Bull Market
Crypto analyst Dan Gambardello recently highlighted similarities between the current market structure and the environment that preceded Cardano’s major rally in 2020 and 2021. His analysis focuses on liquidity shifts after quantitative tightening and their historical influence on risk assets.
Consequently, he noted that phases of tightening followed by renewed liquidity expansion have historically coincided with major upward movements in ADA.
RSI Reset Signals Structural Market Shift
Significantly, Gambardello pointed to the monthly relative strength index resetting after the previous cycle’s peak. According to his analysis, the reset suggests that speculative excess from the prior bull run has largely cleared from the market.
Moreover, he noted that the liquidity contraction he previously anticipated appears close to completion, which could signal a shift toward a new expansion phase if broader economic conditions improve.
Additionally, Gambardello highlighted that several large cryptocurrencies show similar technical compression across longer timeframes. Assets such as Ethereum, Cardano, and Sui appear positioned within tight ranges that historically precede stronger directional moves.

Hence, traders now monitor macroeconomic signals and liquidity trends that could trigger a broader expansion phase across the altcoin market.
Cardano Price Trades Below Key Moving Average
However, the shorter-term chart data shows that ADA continues to trade below an important technical barrier. The price currently sits under the 50-day simple moving average near $0.288, which now acts as the nearest resistance level.
A move above this moving average would strengthen bullish momentum and could shift near-term sentiment toward recovery.
On the downside, market data shows that the $0.24 to $0.25 range continues to serve as a key support zone where buyers previously entered after February’s sharp decline.
Consequently, a break below this area could expose the asset to further downside pressure toward the $0.22 region.
Momentum Indicators Show Mixed Signals
Moreover, momentum indicators still reflect a cautious market tone despite the long-term setup gaining attention. The Awesome Oscillator remains slightly negative, indicating that bearish momentum has not fully faded.
Besides the mixed short-term signals, analysts continue monitoring macro liquidity conditions and long-term indicators that could shape the next phase of Cardano’s market cycle.