
- Bitcoin’s 10 largest Binance withdrawals exceeded 15,000 BTC, up from 6,000–8,000 BTC during February’s price decline.
- Average monthly Binance outflows rose from 18,459 BTC in mid-August to nearly 30,000 BTC, indicating increased exchange withdrawal activity.
- Bitcoin trades near $81,000, below its 50-day and 200-day moving averages, with $80,000 as a key psychological support level.
Bitcoin’s largest withdrawals from Binance have climbed above 15,000 BTC, according to analyst Darkfost, as exchange outflows continue growing. The ten largest withdrawal transactions have increased across several market phases, from February’s price decline to the summer bottom and September’s recovery. Meanwhile, Bitcoin trades near $81,000, below its 50-day and 200-day moving averages.
Binance’s Largest Bitcoin Withdrawals Keep Growing
Darkfost reported that Binance’s ten largest Bitcoin withdrawals have grown steadily over recent months. In February, when Bitcoin fell below $70,000 and touched $62,000, the largest withdrawals reached between 6,000 and 8,000 BTC.
During the summer period associated with the current bear market bottom, another spike approached 10,000 BTC. However, withdrawals increased further from late September onward, exceeding 15,000 BTC. Each phase recorded larger transactions than the previous one, despite different market conditions.
The pattern appeared during a price decline, a market bottom, and an early recovery. Total Binance outflows also increased, supporting the broader trend. Their monthly average rose from 18,459 BTC in mid-August to nearly 30,000 BTC currently.
According to Darkfost, the figures suggest increased buyer activity alongside a changing transaction profile. Large withdrawals now account for a growing share of activity, while smaller transactions associated with retail participants represent less.
Bitcoin Trades Below Key Moving Averages
Bitcoin recently traded near $81,000 after retreating from September and October peaks around 86,000–87,000. Its price remains below the 50-day moving average near $82,800 and the 200-day average around $82,400.
The 50-day average still sits slightly above the 200-day average. However, further declines could produce a bearish crossover if the shorter-term average falls below the longer-term measure.
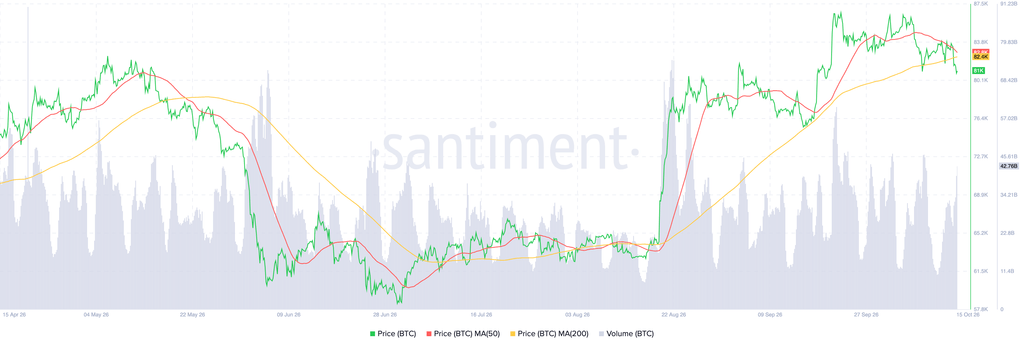
Resistance is between $82,400 and $82,800, where both averages could restrict recovery attempts. A sustained move above that range could expose 84,000–86,000, followed by stronger resistance near $87,000.
$80,000 Remains a Key Bitcoin Price Level
On the downside, $80,000 remains an important psychological level, with potential support between $76,000 and $78,000. Rising selling volume during a break below $80,000 could increase downward pressure.
Conversely, reclaiming both moving averages would strengthen the recovery outlook. Bitcoin previously fell toward $60,000 in June before consolidating between approximately $60,000 and $65,000 through August 21, then breaking above $75,000 around August 22.