
- Bitcoin ETFs recorded $241 million in net inflows, extending their positive streak to three consecutive weeks.
- Ethereum ETFs posted $138 million in net outflows, with Fidelity’s FETH accounting for $74.06 million of withdrawals.
- The latest ETF flows show diverging institutional demand, with Bitcoin attracting capital while Ethereum funds recorded net withdrawals.
U.S. spot Bitcoin ETFs recorded $241 million in net inflows from September 28 to October 2, extending their streak to three consecutive weeks. Meanwhile, spot Ethereum ETFs posted $138 million in net outflows during the same period. Fidelity’s FETH led Ethereum’s withdrawals with $74.0624 million, creating a clear contrast between recent Bitcoin and Ethereum ETF flows.
Bitcoin ETF Inflows Extend Their Positive Streak
Bitcoin ETF activity has varied sharply since the products launched, with large daily inflows and outflows across the period shown. Early 2024 featured several inflow spikes above $500 million, including one near $1 billion.
Bitcoin later saw mixed flows through mid-to-late 2024, with some outflows approaching $1 billion. Activity accelerated from late 2024 into the first half of 2025, including an inflow near $1.3 billion to $1.4 billion around late October.
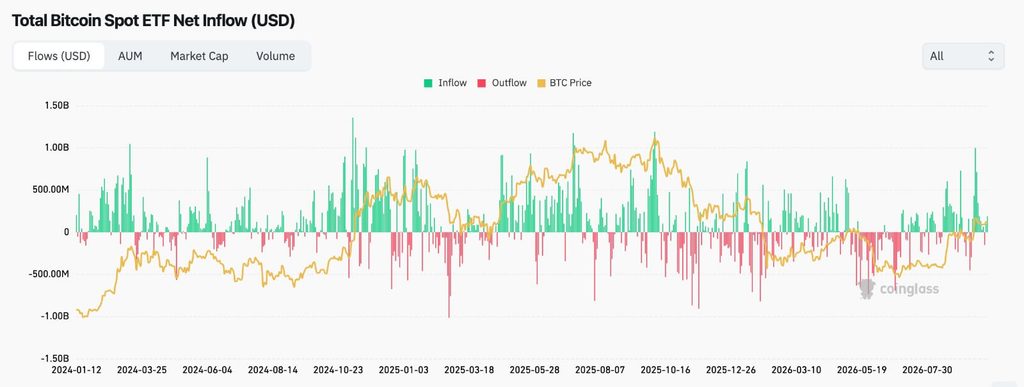
Strong inflows also appeared from May through October 2025 as Bitcoin moved toward the $100,000-plus region. During 2026, flows became more balanced, with smaller inflows and outflows appearing more frequently.
However, the latest chart section shows renewed buying activity, including several inflows above $500 million. The largest recent inflow reached approximately $1 billion.
Ethereum ETF Flows Move in the Opposite Direction
Ethereum ETF flows also remained volatile from July 2024 through early October 2026. Late 2024 brought increasingly positive flows as Ethereum recovered toward the $3,000 to $4,000 range.
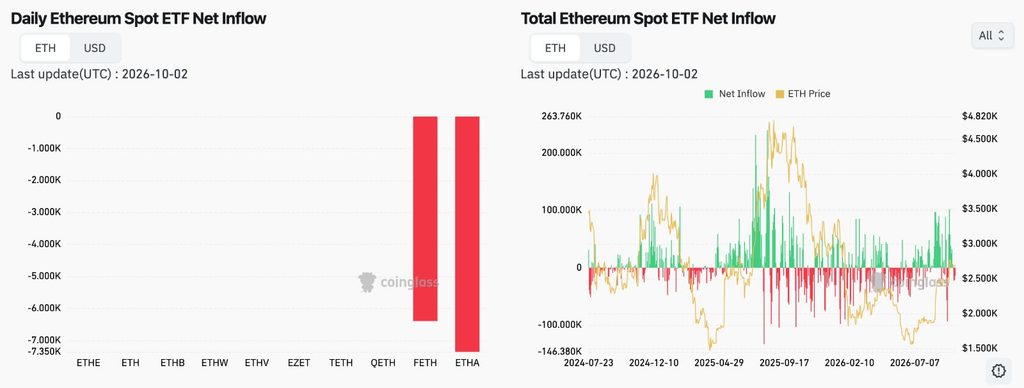
Flow activity remained mixed through 2025, although larger inflows emerged during the middle and latter parts of that year. Several green bars exceeded 100,000 ETH, while the largest approached 200,000 to 250,000 ETH.
That period coincided with Ethereum moving above $4,000 and toward roughly $4,500 to $4,800. During 2026, alternating inflows and outflows became more common.
Latest ETF Data Shows Diverging Weekly Flows
The latest Ethereum section also shows renewed positive activity, with several inflows above 50,000 ETH. Some reached or exceeded 100,000 ETH despite continued volatility. However, the September 28 to October 2 figures show a different weekly result.
Bitcoin ETFs added $241 million, while Ethereum ETFs lost $138 million. Fidelity’s FETH accounted for $74.0624 million of Ethereum’s outflows. The latest Bitcoin data extends its three-week inflow streak, while Ethereum records a weekly net outflow.