
- Cardano’s price is forming higher lows, a pattern that previously led to major rallies, with analysts eyeing a potential 264% surge ahead.
- Market cycles suggest ADA is entering a new breakout phase, with Fibonacci targets pointing to potential resistance levels at $2.77, $4.28, and $7.43.
- Stochastic RSI and MACD indicate weakening bearish momentum, suggesting that ADA could gain strength if it holds key support at $0.70.
Cardano (ADA) shows notable technical progress with higher lows and evolving breakout patterns. The digital asset currently trades at $0.7301, marking a modest increase in recent trading activity.
Breakout Patterns and Market Cycles
A recent tweet from crypto influencer JavonTM1 indicates that ADA is forming higher lows that may lead to an upward price move. Historical patterns show that prolonged accumulation often leads to major breakout phases. The tweet mentions that previous bullish runs pushed ADA to its all-time high before a consolidation phase occurred.
Technical analysis reveals that the first major breakout followed an accumulation period. A subsequent breakdown led to another period of consolidation marked by a blue/purple zone. The second breakout appears to have fueled another rally, following historical price fractals. Price targets are set at $2.776000, $4.286071, and $7.431582, based on past resistance levels and Fibonacci extensions.
Technical Analysis Indicators
The current Stochastic RSI shows the blue line at 42.13 and the orange line at 29.02. These values place the indicator in a neutral range, suggesting neither overbought nor oversold conditions exist. The recent crossover from below the 20 level may hint at an upcoming bullish reversal. Confirmation is awaited if the blue line moves above the orange line and climbs past 50.
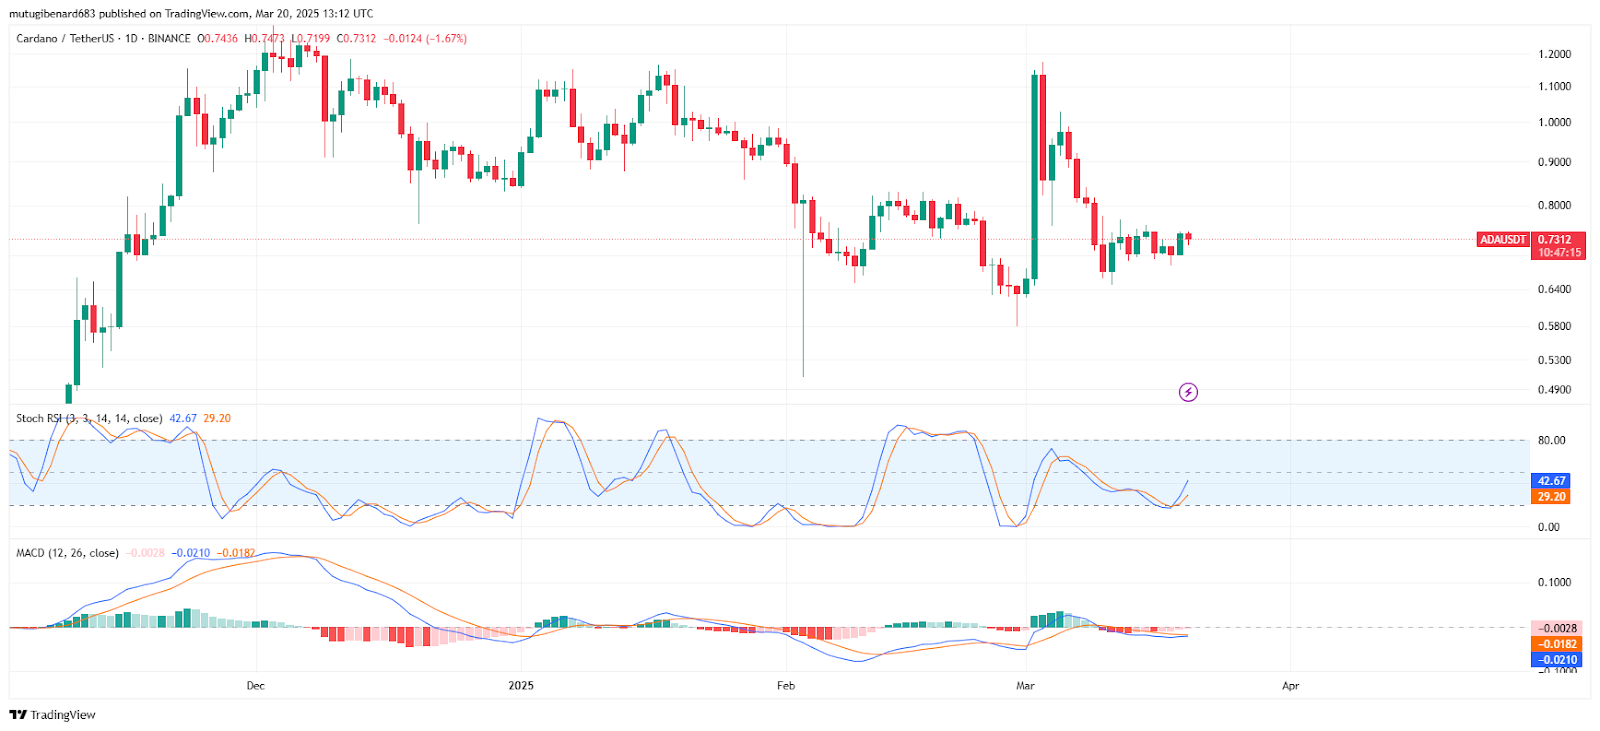
MACD values reflect continued bearish momentum with the blue line at -0.0029 and the orange line at -0.0211. The MACD histogram remains negative with shrinking red bars. Such conditions indicate that the bearish momentum is weakening. A bullish reversal could be signaled if the MACD line crosses above the signal line.
Support and Resistance Levels
Key support levels for ADA are observed at $0.70 and $0.64. These levels serve as psychological and technical barriers. Resistance is noted between $0.78 and $0.80, while the $0.90 to $1.00 range marks a major challenge. The market respects these levels based on historical performance.
Recent candles show small-bodied formations that suggest trader indecision. A sharp bullish spike occurred in early March but was met with strong selling pressure at higher levels. ADA must hold the $0.70 support to maintain the potential for a breakout. A drop below that level could push the price toward $0.64.
The technical setup for Cardano presents a clear cyclical pattern. Historical trends and current indicators point to the possibility of another bullish phase.