
- Successive higher lows suggest buyers are defending elevated support, although resistance must break before bullish momentum receives confirmation.
- Derivatives volume advanced by 26.07% to $27.61 million with open interest growing to $62.09 million as trading activity resumed.
- Short liquidations reached $30.51K over 24 hours, exceeding long liquidations as traders navigated changing market conditions.
SHIB is showing early signs of recovery as higher lows develop during consolidation, while derivatives data reveals increased participation and competing market positions.
Higher Lows Offer an Early Sign of Recovery
$SHIB KNIGHT recently described several days of consolidation marked by consistently rising lows. The account suggested this formation could precede a breakout if buyers maintain control. However, the market has yet to confirm that anticipated move through a decisive resistance break.
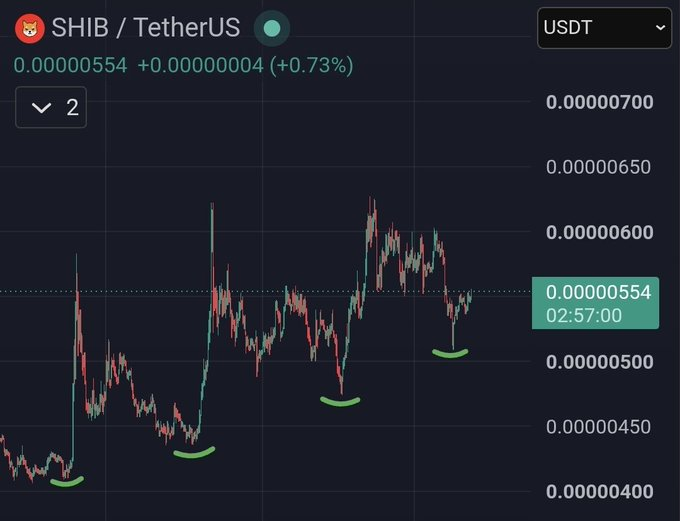
The recent structure follows an earlier advance toward $0.0000060. That rally was then halted by pullbacks, although buyers are still coming back at higher levels. The sequence indicates that the selling pressure has faded in recent retracements.
Earlier support appeared around $0.0000043, followed by lows near $0.0000047. A significant $0.0000051 trough appeared, continuing the rise. These levels are useful for gauging integrity of the developing structure.
The latest intra-day chart shows a less bullish outlook. The token climbed to about $0.000005525 before heading back to $0.000005408. That reversal shows sellers remain active despite the earlier recovery and improving support pattern.
Derivatives Data Shows Conflicting Market Positions
Trading activity has increased alongside the developing technical structure. Volume of reported 24-hour derivatives rose 26.07% to $27.61 million. Outstanding contracts rose also, with open interest rising 1.95% to $62.09 million.
The increases show more participation, but they don’t prove who’s winning the market. Open interest increases can occur when trading up into new bulls and new bears. There needs to be more price action to determine the direction of that activity.
The overall 24-hour long-short ratio was 0.8744, indicating a relative underweight short position. Meanwhile, OKX’s long-short ratio was 2.74. The contrasting readings indicate that positioning differs between exchanges and trader groups.
Liquidation figures provide another view of recent market pressure. Total liquidations reached $43.09K over 24 hours, including $30.51K in shorts. Long liquidations accounted for the remaining $12.58K during the same period.
Resistance Levels Will Determine the Next Direction
The historical liquidation chart shows several sharp spikes during volatile trading periods. Notable episodes appeared around early June, late July, and August 20–21. These are examples of how price fluctuations can cause forced exit of leveraged positions.
A short liquidation may add to the buying when prices shoot up out of nowhere. However, the numbers reported do not prove a long-term short squeeze. If there is still demand, then there will be further developments to follow after those mandatory closures are lifted.
To be honest, it would be important to have a technical area in between $0.0000057 and $0.0000060. This zone is above the most recent price shown if there have been trading peaks previously. If the bulls can move through that area again then it will give them more confirmation of renewed bullish momentum.
Support at $0.0000051 is also noteworthy as it sets up the recent higher-low pattern. A break below this area will take pressure off the structure. Further declines could bring $0.0000050 and $0.0000047 into focus.
The market is giving two different signals at this point – rather than an obvious directional change. Participants have started to increase, and low levels have climbed, suggesting better recovery, while recent sales indicate that resistance exists. Buyers’ defense of support and breaking overhead supply will be the next key step.