
Key Insights
- Cardano forms a short-term golden cross as broader crypto markets decline, creating mixed signals that weaken bullish momentum and delay immediate upside potential.
- ADA trades between $0.22 support and $0.257 resistance, with repeated rejections confirming strong selling pressure and limiting breakout attempts in April sessions.
- Negative funding rates and $254 million in liquidations show traders remain defensive, reinforcing consolidation despite technical indicators suggesting a potential momentum shift ahead.
Cardano has printed a short-term golden cross on its three-hour chart as the 50-period moving average has moved above the 200-period line. This signal appeared for the first time in April and usually reflects improving momentum. However, the broader market trend weakened at the same time, which reduces the strength of this technical signal.
Besides the crossover, price action moved lower across major crypto assets, creating a conflicting setup. The timing has drawn attention because such signals typically align with upward momentum, not declining prices.
Market Liquidations Add Pressure to ADA Trend
The wider crypto market recorded $254 million in liquidations within 24 hours, with long positions accounting for $180 million. This imbalance shows that traders expected higher prices but faced rapid losses as prices dropped. Consequently, this pressure has limited the immediate upside potential for ADA.
Additionally, short liquidations reached $74 million, but they did not offset the broader bearish sentiment. The liquidation data confirms that traders remain cautious, even as technical signals suggest a possible shift.
ADA Price Holds Range Between Key Levels
ADA currently trades near $0.2496 after declining for two consecutive days, though it still shows a weekly gain of 4.80%. The asset has remained within a defined range between $0.22 and $0.30 since early February. This consolidation reflects a lack of strong directional conviction from both buyers and sellers.

Moreover, repeated attempts to break above the daily 50-day moving average near $0.257 have failed several times in April. Each rejection has reinforced this level as a strong resistance zone that buyers must overcome.
Resistance and Support Define Short-Term Direction
Recent price attempts reached a high of $0.264 before reversing, showing clear selling pressure at higher levels. Hence, the daily MA 50 continues to act as a barrier that prevents sustained upward movement. A successful break above this level would open the path toward the $0.30 range.
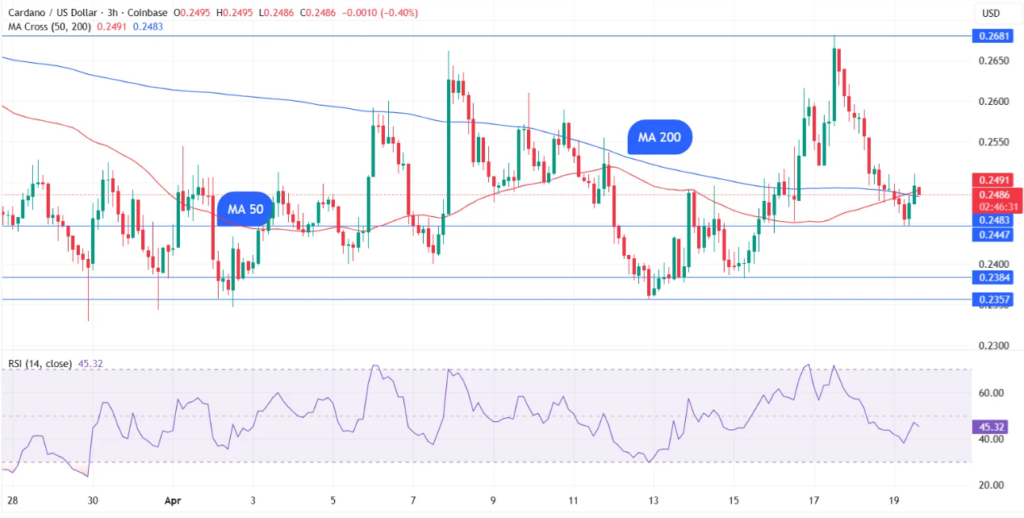
On the downside, support remains steady near $0.22, which has held firm during recent pullbacks. The RSI sits near 50, indicating neutral momentum and suggesting that price may continue moving sideways in the near term.
Derivatives Data Signals Defensive Positioning
Funding rates across perpetual futures markets remain negative, reflecting a defensive stance among leveraged traders. This trend indicates that traders still favor downside protection rather than aggressive long positions. Consequently, sentiment remains cautious despite the appearance of bullish technical signals.
Significantly, the combination of neutral RSI, negative funding rates, and resistance pressure highlights a market waiting for confirmation. Price structure continues to show consolidation rather than a clear breakout trend.