
Key Insights
- Zcash open interest dropped sharply from $763 million to $560 million, reflecting reduced participation and confirming that traders are closing long positions.
- The long-to-short ratio below one indicates growing bearish sentiment, as more traders position for downside movement following last week’s strong rally.
- Zcash holds above major moving averages despite the pullback, showing broader trend strength while short-term indicators signal cooling momentum and ongoing consolidation.
Zcash continues its downward move this week, slipping below the $335 level. The asset has now lost more than eight percent in recent sessions. Consequently, the pullback reflects a cooling phase after the sharp rally.
Market data shows a steady decline in trader participation over recent days. Open interest dropped significantly from earlier highs, indicating reduced exposure. Hence, the trend suggests traders are closing positions rather than adding new ones.
Open Interest Decline Highlights Exit Activity
Zcash open interest fell from $763 million to near $560 million. This drop aligns with the price decline seen across the same period. Moreover, such movement confirms that long positions continue to unwind steadily.
The long-to-short ratio currently sits below one, signaling bearish dominance. Traders are increasingly positioned for further downside movement in the short term. Additionally, this shift highlights growing confidence among sellers in current conditions.
Price Holds Above Key Moving Averages
Despite the correction, Zcash remains above major exponential moving averages. These indicators cluster between the $281 and $292 levels. However, price strength appears to weaken as momentum slows after last week’s surge.
Last week’s rally of nearly 47% triggered strong profit-taking. Traders now lock in gains, contributing to the ongoing correction phase. Consequently, selling pressure continues to outweigh buying demand in the near term.
Fibonacci Level Provides Immediate Support
The $327 region acts as the first support level based on Fibonacci retracement. Price currently tests this area as the market searches for stability. Besides, holding this level could limit deeper downside in the short term.

The relative strength index remains elevated but shows signs of easing. Meanwhile, the MACD indicator still supports bullish momentum but weakens gradually. Hence, indicators reflect a slowing upside rather than a full reversal.
Broader Support Zone Remains Intact
Strong support extends further down toward the $291 to $281 range. This zone aligns with key moving averages and past consolidation levels. Moreover, it provides a cushion against sharper declines if pressure increases.
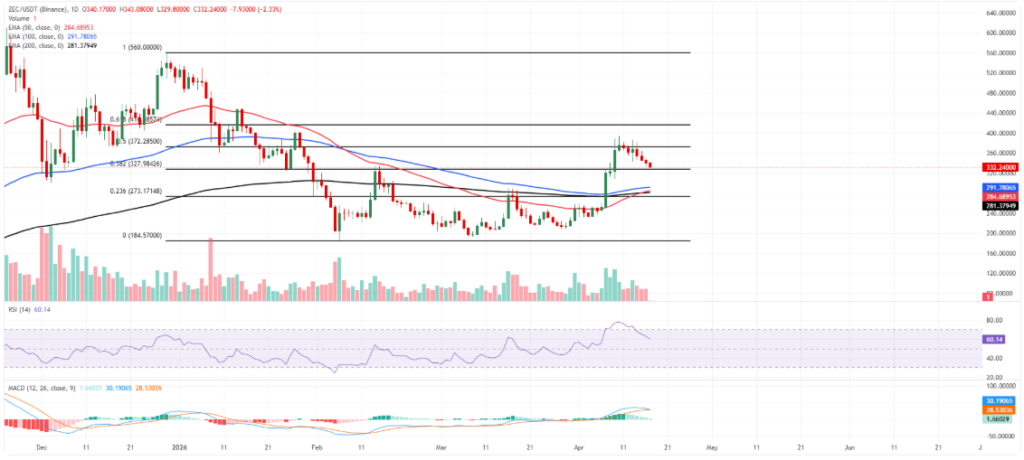
If selling continues, the price could test the $273 support level next. This level represents a deeper retracement within the broader trend. Additionally, a break below this zone could expose further downside toward cycle lows.
Resistance Levels Remain Clearly Defined
On the upside, Zcash faces resistance near the $372 level. Further barriers appear at higher Fibonacci retracement zones. Consequently, these levels may slow any recovery attempts in the near term.
Zcash currently trades in a transition between a strong rally and a correction. The market adjusts as traders reassess positions following recent gains. Moreover, reduced participation reinforces the ongoing consolidation phase.
Traders Monitor Volatility Shifts Closely
Volatility remains elevated as the price reacts to changing sentiment. Short-term moves continue to depend on derivatives’ positioning. Hence, traders focus on data signals to gauge the next directional move.
Zcash maintains a broader upward structure despite short-term weakness. However, current conditions favor a controlled correction rather than immediate continuation. Consequently, price action reflects a pause within a larger trend.