
- Two-year weekly chart bullish divergence by Zilliqa indicates weakening bearish momentum and a possible reversal in the coming future.
- A technical price consolidation over the $0.0117 trendline favors the bull reversal hypothesis as the market waits for a breakout or a rejection.
- The Stochastic RSI and the On-Balance Volume are technical indicators which indicate developing positive momentum and the potential for a price rise.
Zilliqa (ZIL) continues to exhibit a bullish divergence on its weekly chart, a setup that has now lasted over two years. This persistent structure suggests the asset may be nearing a major rebound.
Multi-Year Pattern Signals Potential Bullish Reversal
Zilliqa continues to form lower lows on its price chart while its oscillator indicators show higher lows over the same period. This setup indicates a classic bullish divergence, pointing to weakening downward momentum. The divergence is playing out on the weekly timeframe, lending added weight to its potential outcome.
This divergence between price and momentum signals weakening bearish pressure. The setup, according to on-chain analyst Javon Marks, reflects a maturing bullish divergence pattern. The chart supports this, showing ZIL holding above the key support level, resisting breakdowns, and signaling a potential reversal is forming.
Bullish Divergence Builds Confidence for Zilliqa
The presence of bullish divergence on the Zilliqa chart has drawn attention as the market searches for direction. Bullish divergence is clearly visible as ZIL’s price consolidates just above its multi-year trendline at $0.0117. While ZIL has dropped 2.84% in the past 24 hours and 10.93% over the week, the structure remains intact. Each test of the trendline without a breakdown adds weight to the bullish reversal narrative.
The sustained pattern positions ZIL for a move higher, should the trendline be retested and confirmed with volume. Javon Marks suggests this could act as a technical trigger, marking a turning point after a prolonged downtrend.
Indicators Suggest Momentum Shift
Zilliqa’s On-Balance Volume stands at 104.68 billion, showing long-term accumulation despite the absence of explosive volume activity. This suggests a quiet buildup of buying pressure without major spikes.
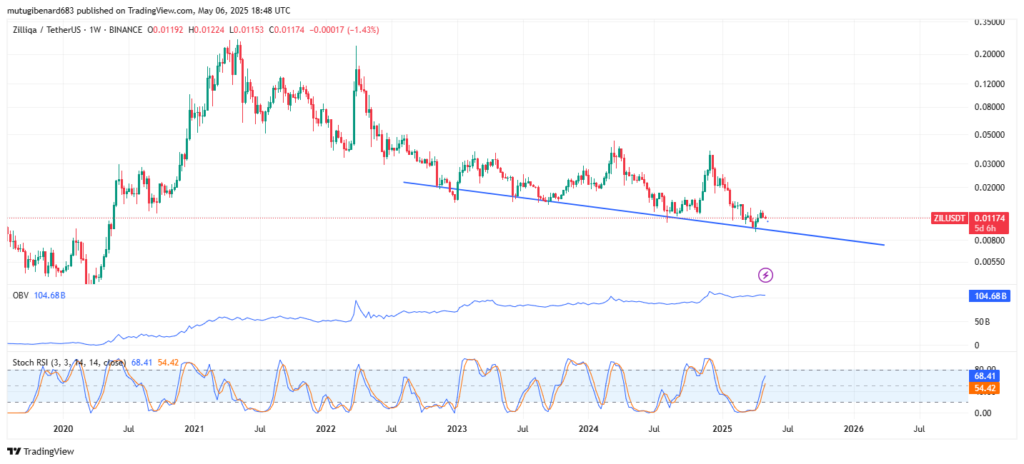
The Stochastic RSI currently supports the bullish case. The %K and %D lines are trending upward after crossing out of oversold levels. This technical momentum shift, along with the price testing key resistance, strengthens the probability of a possible rebound move in the short term.