

- $ZEN struggles below $13, forming a descending channel with key support at $9.5 and potential resistance at $19.91.
- RSI at 29.69 suggests oversold conditions while rising trading volume hints at possible market shifts.
- A breakout above the downtrend could push $ZEN toward $28-$30, while a drop below $9 may extend losses further.
$ZEN has been experiencing a prolonged decline, with price movements indicating ongoing selling pressure. The asset has been unable to maintain levels above key resistance points, bringing it closer to lower support zones. Traders are watching technical indicators for potential changes in trend direction.
$ZEN Price Struggles Below $13 as Downtrend Persists
A recent tweet shared by Alpha Crypto Signal focused on $ZEN’s downtrend, noting a descending channel in its daily chart. As per the tweet, the asset could not sustain price values over $13, with bears’ pressure taking it towards strong support at $9.5. Lower lows and lower highs validate the prevailing downtrend.
The immediate price reaction is that a break below $9.5 could see additional drops follow, but a short-term reaction could occur with buyers supporting at this level. To confirm a reversal, a structural change with a new high high is required.
Technical Indicators Suggest Oversold
The Relative Strength Index (RSI) stands at 29.69, and in oversold terms, it stands at a level in the past when such values have recovered, assuming buying activity revives. There is an increase in trading volumes, and that could represent a change in behavior amongst market participants.
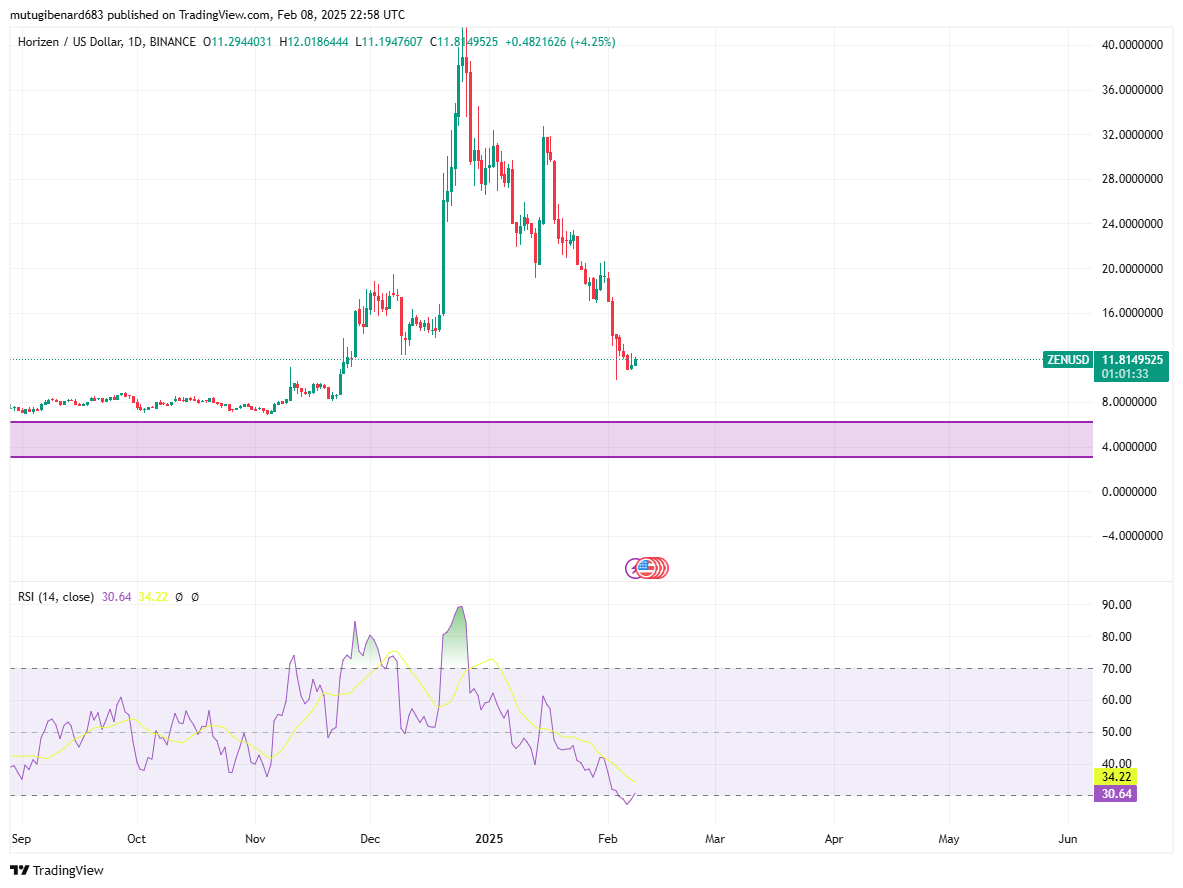
The asset stays in a downtrend in a parallel channel, and its lower boundary acts as immediate support. Any break over the channel can cause a price move towards $28–$30. On the contrary, a failure to sustain a price over $9.5 can cause it to move even below $9.
Key Support and Resistance Levels in Focus
The primary support range for $ZEN is between $9.67 and $13.01, where prior buying interest has been recorded. Holding this zone could lead to a short-term recovery. Meanwhile, resistance is observed at $19.91, aligning with the 25-day Simple Moving Average (SMA), which could serve as a barrier to upward movement.
If the price manages to reclaim $20 with sufficient volume, further upward momentum could develop. However, a breakdown below $10 may push the asset toward the next major support area between $3.50 and $5.00.n
The overall trend remains downward, with price action continuing to reflect a seller-dominated market. A sustained move above key resistance levels is necessary to signal a shift in trend. Market participants are closely monitoring volume activity and RSI levels to determine potential buying opportunities. Until a structural change occurs, the possibility of further price decreases remains present.