
- XYO’s symmetrical triangle formation implies a possible breakout, and analysts predict the potential for a 291% spike to $0.06949.
- Key resistance levels around $0.016 could start the trend towards $0.020–$0.025, while the failure to hold could test support levels around $0.005.
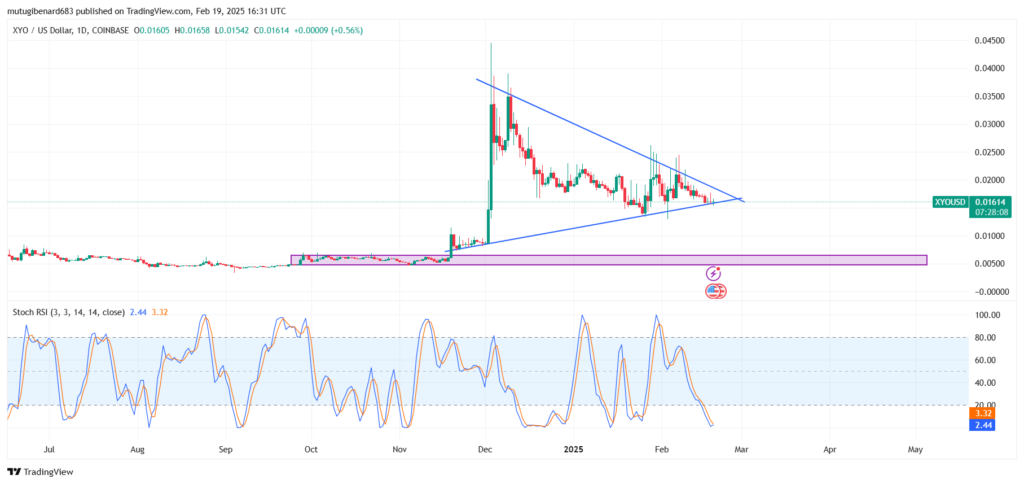
- The Stochastic RSI is showing overbought levels, suggesting reduced selling momentum and possible reversal towards the upside for the next several sessions.
XYO continues its breakout trend, keeping investors interested in its direction. XYO was at $0.01604 at the time of writing, and analysts are keeping close eyes on its movements. Even after declining by 4.28% over the recent week, the strong technical trend implies the potential for breakout that can yield high returns.
Technical Analysis Suggests Breakout Potential
A symmetrical triangle has now formed on the price chart for XYO, where trend lines converging form the compression zone. This is suggestive of the breakout, the direction for which will determine the next trend. An upper trend line is the declining level of resistance, and the lower trend line is the rising level of support. Breakout through the level of resistance will cause the price to head towards $0.020 to $0.025, and the breakdown will test the lower support levels around $0.005.
Crypto analyst Javon Marks pinpointed the potential for XYO reaching the level of $0.06949. He added holding onto the gains after the breakout is the potential for the rise by 291%. Another tweet by Marks confirmed XYO’s current price action is reflective of the trend’s continuation, projecting the rise by 222% from the current levels.
Support and Resistance: Central To Price Action
XYO’s immediate support is $0.016, the current price level. A good breakout over this level can confirm the bullish scenario, setting the direction towards $0.020-$0.025. In the downside, the significant support is $0.005. If the price fails to hold the lower edge of the symmetrical triangle, the possible fall towards this support level can follow.
Meanwhile, the Stochastic RSI is also suggesting XYO is reaching levels of being overbought. With the levels being the blue line (1.83) and the orange line (3.47), the selling momentum appears to be abating. If the blue line crosses over the orange line, this will likely signal the reversal towards the upside, supplementing the XYO’s bullish argument.
Market Watch: Traders Monitor Breakout Confirmation
Traders are holding their breath for the breakout over or under the triangle formation for the next direction. Breakout confirmed by high volume can drive XYO towards its highest price levels, whereas breakdown can make the price dip even lower. Analysts projecting the upside continuation, all eyes now turn towards whether XYO can sustain its gains and make all-time highs.