
- XRP’s four-hour Bollinger Bands have tightened to their narrowest levels since August, with $1.27 and $1.23 marking bullish and bearish confirmation levels.
- Santiment recorded 7,934 new XRP wallets on November 1, the sixth-highest daily total in 2026, while total holders reached 8.29 million.
- XRP remains below its 50-day and 200-day moving averages near $1.27 and $1.36, with support at 1.22–1.25.
XRP is holding near $1.25 as tightening Bollinger Bands, growing wallet numbers, and declining network activity shape its latest market outlook. On November 3, 2026, the cryptocurrency traded at $1.248, below two major moving averages. Analysts are watching $1.23 and $1.27 for confirmation of its next price direction.
XRP Traders Watch $1.23 and $1.27 Breakout Levels
According to analyst Ali Charts, XRP’s four-hour Bollinger Bands have narrowed to their tightest levels since August. The previous compression preceded a 71% rally within three days. However, the current squeeze does not establish which direction the next move will take.
Ali Charts identified $1.27 as the bullish confirmation level and $1.23 as the bearish level. A four-hour close above $1.27 would support an upward move. However, a close below $1.23 would indicate further downside pressure. Until either level breaks, the analyst considers 1.23–1.27 a no-trade zone.
Santiment Reports 7,934 New XRP Wallets
Meanwhile, Santiment Intelligence reported 7,934 new XRP wallets on November 1. This represented the sixth-highest daily total recorded in 2026. Notably, the increase occurred on Sunday, typically one of the quieter days for cryptocurrency network activity.
Santiment noted that the surge followed a busy week and came after the Binance hack. The incident may have encouraged users to move toward self-custody and create new wallets.
The analytics platform identified $1.25 as XRP’s immediate price pivot and $1.30 as the first confirmation level. Daily wallet creation staying above 4,000 alongside a recovery above $1.30 would strengthen the setup. However, a drop below $1.20 and wallet growth under 3,000 would weaken it.
XRP Remains Below Major Moving Averages
The daily chart shows XRP declining from approximately 1.40–1.45 in May before approaching $0.98 in August. It subsequently recovered above $1.50, reaching approximately $1.60 in late September. However, October brought another decline, leaving XRP consolidating around 1.24–1.25.
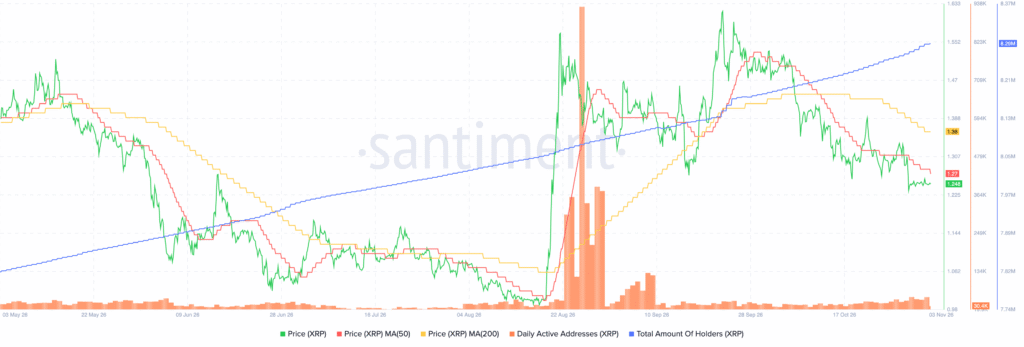
The 50-day moving average stands near $1.27, while the 200-day average is around $1.36. XRP currently trades below both levels. Daily active addresses have also declined to approximately 30,400 following an extraordinary late-August spike.
Meanwhile, total holders have increased to approximately 8.29 million. Immediate support is at 1.22–1.25. A breakdown could expose $1.20 and $1.10, while recovery above $1.27 could bring $1.30 and $1.36 into focus.