
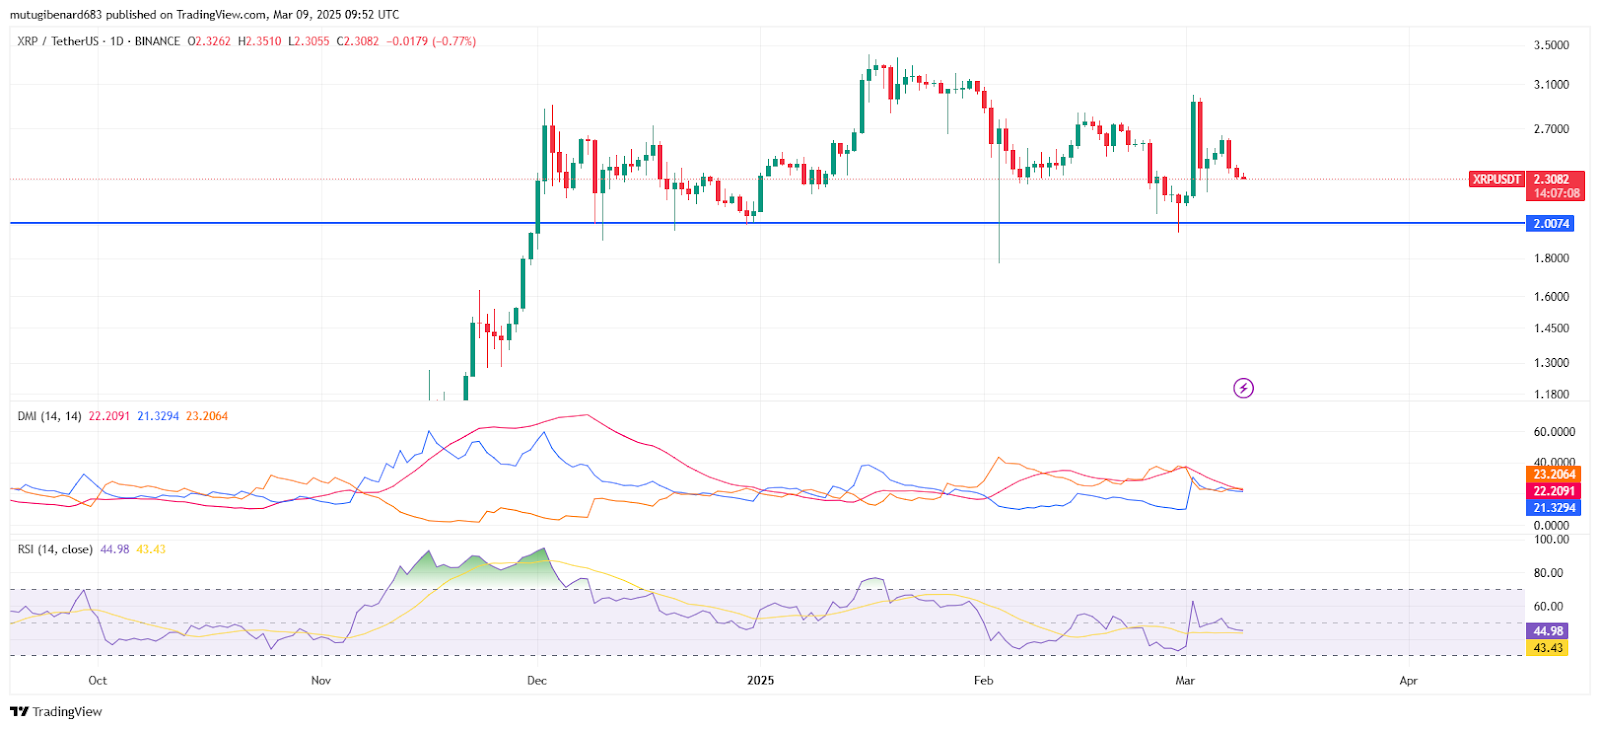
- XRP chart shows an inverse head and shoulders pattern with right shoulder formation, signaling a bullish reversal if it holds above $2 support.
- The Directional Movement Index shows nearly equal DI+ and DI- values, with ADX at 23.2064 and RSI at 45.21 reflecting neutral momentum.
- A bullish breakout may occur if XRP breaks above the $3.00 neckline, with potential price targets projected near the $4.00 to $5.00 range.
XRP technical analysis on Binance indicates an evolving chart pattern with crucial support and resistance levels. The analysis points to a potential reversal and a shift in market sentiment. The current setup demands careful observation from market participants.

A tweet by a prominent analyst in the crypto space, Ali_charts, explained that XRP must avoid closing below its head-and-shoulders neckline. He noted that a break above the right shoulder could invalidate the bearish setup and may trigger a bullish breakout toward the $5 level. This insight has drawn the attention of traders and technical analysts alike.
Inverse Head and Shoulders Pattern
The chart displays an inverse head and shoulders pattern with the left shoulder forming in December 2024. The head reached a significant low in early 2025. The right shoulder is now in development and awaits confirmation. A strong support level near $2.00 serves as a critical demand zone. The neckline resistance at approximately $3.00 is closely watched by market participants. Traders consider the pattern a potential indicator of a trend reversal if confirmed by price action.
The formation reflects structured price behavior over recent sessions. It sets the stage for traders to identify key levels for potential entries or exits. The pattern remains under scrutiny as market conditions evolve.
Indicator Analysis and Market Conditions
The Directional Movement Index provides DI+ as 22.2091 and DI- as 21.3294. The ADX value is 23.2064, which signifies that the trend is weak. The Relative Strength Index is 45.21, which signifies neutral momentum.
Traders should look for the RSI to rise above 50 if the pressure is positive. A decline below 30 would signify oversold conditions, which would need a closer examination. These technical indicators help traders to ascertain the strength of the prevailing trend.
Potential Scenarios and Price Projections
A bullish scenario may develop if XRP maintains support above $2.00. This condition could drive the price toward a breakout and project a move in the $4.00 to $4.80 range. The tweet by Ali reinforces the idea that closing above the neckline is key to the bullish reversal.
The market price will likely continue falling if it breaks through the $2.00 mark toward the target area of $1.80 and potentially below that level. XRP maintained its position at $2.3175 with an active trading volume reaching $2,510,616,358 at the time of this analysis.