
- XRP gained 8.22% in three days after whale accumulation exceeded $2B, according to analyst Ali Charts.
- XRP approached the $1.55-$1.60 resistance zone, where about 2.50B XRP previously changed hands, according to URPD data.
- XRP’s RSI reached 73.81 while MACD remained positive, keeping momentum elevated as traders watch resistance near $1.60.
XRP has climbed 8.22% in three days after whales accumulated more than $2 billion worth of XRP, according to Ali Charts. The rally has pushed XRP toward the $1.55-$1.60 area, while Javon Marks identified a much higher measured target. Chart data shows strong momentum, although RSI has moved above the overbought threshold.
Whale Buying Lifts XRP Toward $1.60
Ali Charts said recent whale accumulation now appears in XRP’s price action. According to the analyst, the token gained 8.22% over three days following purchases exceeding $2 billion. The analyst also pointed to XRP’s URPD data.
It shows relatively little resistance before $1.60, where about 2.50 billion XRP previously changed hands. Ali Charts identified that level as the next major area for potential profit-taking.
Meanwhile, Javon Marks said XRP continues pushing higher after a smaller breakout. He described that break as the starting point for a larger continuation move. Marks placed the measured move target above $15, more than 850% from the current level.
XRP Breaks Above $1.50
The four-hour chart shows XRP at $1.5365, up 1.18% on the latest candle. The candle opened at $1.5187, reached $1.5545, and fell to $1.5140. Since the September 16 low near $1.27-$1.30, XRP has formed higher lows.
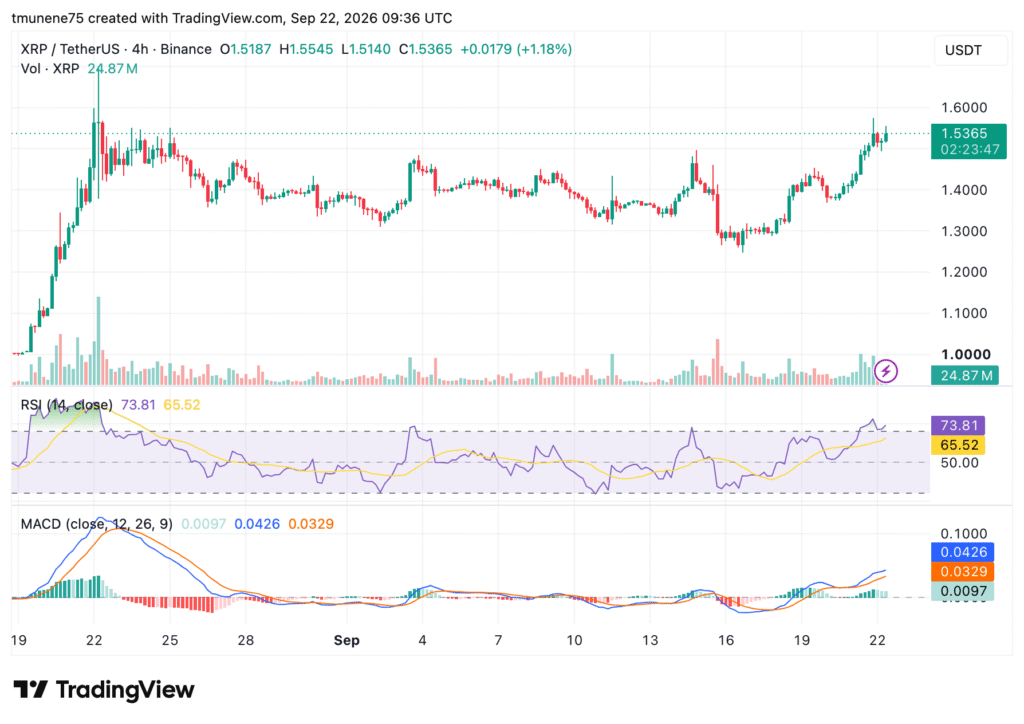
It then moved above $1.40 before breaking through $1.50. That move has brought XRP closer to the $1.55-$1.60 resistance region. The area previously served as an important trading zone, according to the chart.
RSI Rises While MACD Stays Positive
Momentum indicators remain elevated alongside the price move. RSI is at 73.81, above its 65.52 moving average and the 70 overbought threshold. However, the elevated RSI leaves room for short-term consolidation or a pullback.
RSI remains above its moving average, keeping momentum stronger on the buying side. The MACD also remains positive. Its line stands at 0.0426, above the 0.0329 signal line, while the histogram reads 0.0097.
The immediate resistance sits at $1.55-$1.60. A break above $1.60 would expose $1.65, while support sits at $1.50, $1.40, and about $1.30.