- XRP is exiting a descending channel pattern, similar to past bullish cycles, indicating the potential for a massive price surge above $3.
- Rising On-Balance Volume and MACD confirmation highlight strong accumulation and bullish momentum, reinforcing the likelihood of a breakout rally for XRP.
- XRP’s breakout and support above key levels suggest a clear path toward $3, replicating previous explosive price movements observed in late 2024.
XRP price analysis reveals a possible major breakout as the asset moves beyond a descending channel after prolonged consolidation.
Technical Patterns Suggest Potential Upside for XRP
A recent tweet from chart analyst Javon Marks outlines a compelling technical setup in XRP’s daily price chart. The post describes a pattern where each consolidation phase forms a descending channel or flag, followed by a strong breakout. According to Marks analysis, the current formation mirrors previous cycles that led to substantial upward moves.
This latest descending channel appears to be breaking to the upside, forming what many traders identify as a classic bull flag. Historical patterns indicate that similar structures in XRP’s chart were followed by rapid surges in price. The chart’s volume profile further supports this view, showing lower activity during accumulation phases and sudden spikes during breakout periods.
Marks highlights the symmetry in past breakout trajectories using green arrows, suggesting a potential repeat of bullish momentum. Based on previous cycles, XRP might be positioned for another rally that could take it beyond the $3.00 mark.
Indicators Confirm a Bullish Reversal
From a technical standpoint, multiple indicators are aligning with this bullish setup. The On-Balance Volume (OBV) has climbed to 49.26 billion, indicating growing accumulation. A recent breakout above the upper channel boundary is seen as a potential signal of trend reversal.
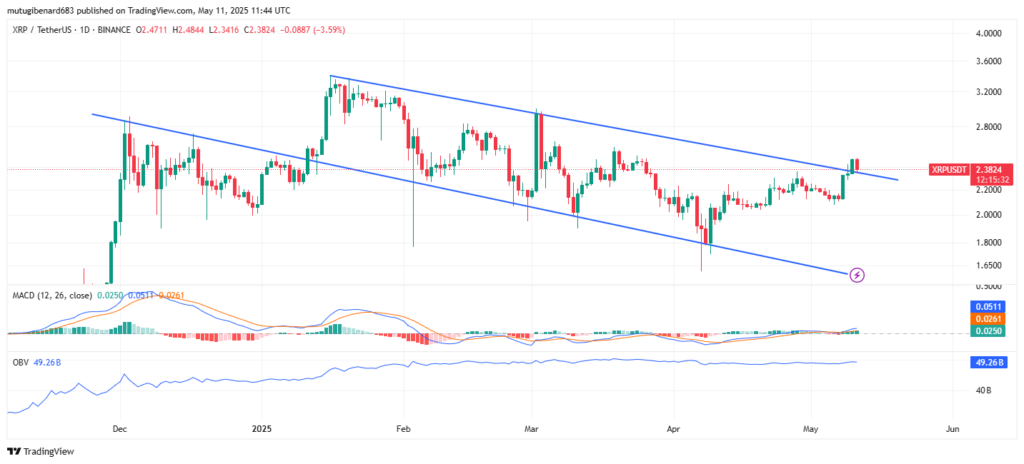
The MACD indicator also shows bullish momentum building. The MACD line has crossed above the signal line, confirming the positive trend. Although the daily candle shows a slight price pullback, the movement is viewed as a retest of the breakout zone rather than a rejection. This behavior is consistent with previous bullish formations in XRP’s chart.
If XRP continues trading above the descending channel, this may act as a new support zone. Technical traders often interpret such developments as preparation for stronger price movement.
XRP’s Current Price Movement and Market Context
At the time of publication, XRP is valued at $2.38, down 0.05% over the last 24 hours. In spite of the minimal drop, the token posted an 8.61% increase over the last week, showing a general bullish trend.
The last notable breakout in late 2024 followed a similar pattern, adding historical confidence to the current setup. This context strengthens the belief among technical analysts that XRP could soon initiate another rally phase.
Javon Marks’ technical breakdown adds a structured viewpoint to XRP’s current price action, with chart patterns and indicators closely watched by market participants.