- XRP is forming a descending wedge, signaling potential price movement as traders monitor key support at $2.50–$2.60 and resistance near $3.00.
- Two conflicting indicators exist within the market as the MACD shows bullish signs yet RSI maintains a neutral position before traders can confirm market direction.
- A subsequent price rise above $3.00 could propel XRP toward $3.50–$3.80 as an opposite movement below $2.50 might trigger a downward trend to $2.00.
XRP is trending inside a downward wedge that is traditionally a bullish sign of a change of trend. The coin is priced at $2.5662 at the time of writing with a small decline of 0.79%. Traders are following a strong area of resistance between the levels of $2.85 to $3.00 which will lead to its next major movement.
XRP’s Market Structure & Levels
Crypto analyst ali_charts noted that XRP is forming an ascending triangle on lower time frames that can lead to a 4% movement of the price. In the overall market structure, a descending wedge is being formed with XRP forming lower highs while maintaining higher lows. It is a price consolidation sign with a potential breakout or breakdown to soon occur.
Bullish momentum will depend on maintaining support at the price zone which spans from $2.50 to $2.60. A price fall below the support area would push the market value down to $2.00–$2.20 levels that hold supplementary support. On the upside, breaking past $3.00 would open the possibility of reaching $3.50–$3.80, with further upside potential beyond $4.00 if buying pressure strengthens.
Technical Indicators & Market Sentiment
Momentum indicators are showing divergent signals. Moving Average Convergence Divergence (MACD) is showing a positive histogram with the MACD line at 0.0249 crossing the signal line at -0.0146. It is a signal of a potential bullish changeover.
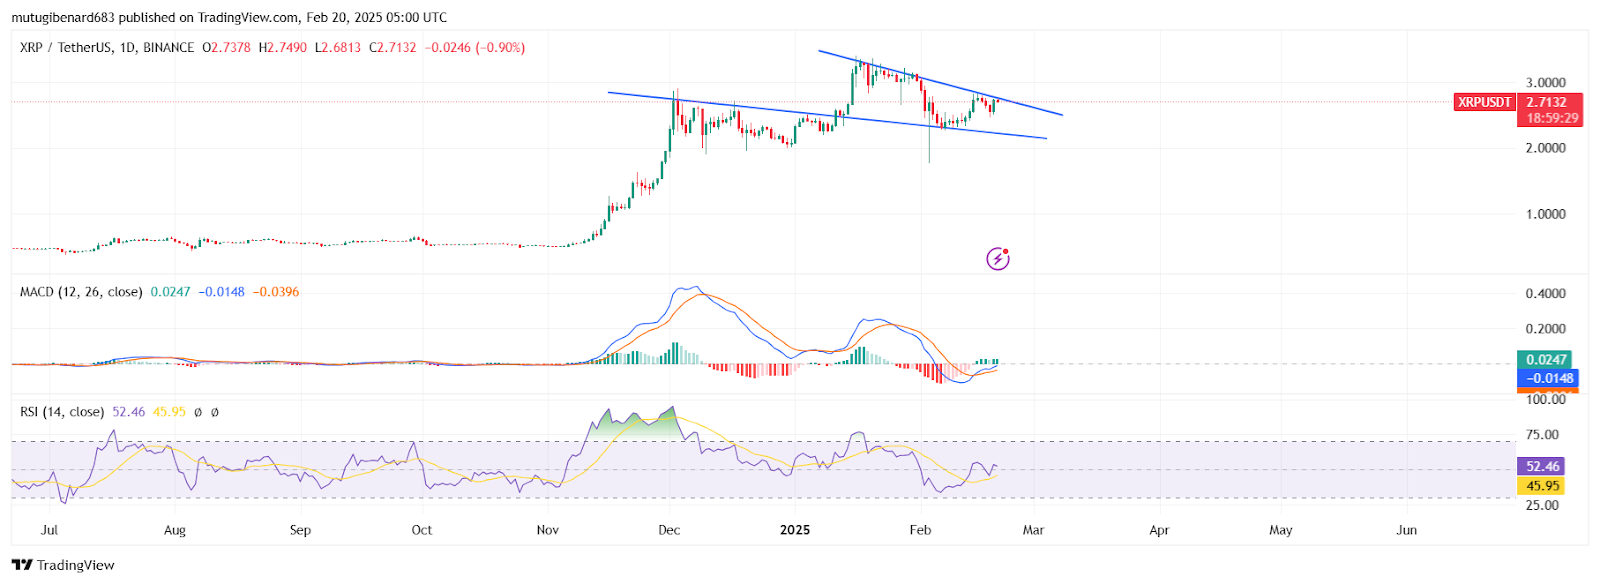
Meanwhile, the Relative Strength Index (RSI) is at 52.60 with XRP remaining at a middle ground area. An RSI break out at 60 would indicate strong buying pressure while a decline to below 45 could indicate weakening.
Possible Scenarios of the Price of XRP
A bullish breakout scenario could see XRP surpassing the $2.85–$3.00 resistance level, confirming an upward move toward $3.50–$3.80. If momentum continues, XRP could even approach $4.00. However, a bearish breakdown would materialize if the price falls below $2.50, increasing the likelihood of testing lower support at $2.20–$2.00.
Traders are paying very close attention to the major support and resistance levels with XRP at a turning point. The next couple of days will indicate if the coin can hold the gains made or will encounter increased pressure to sell again.