
- XRP’s TD Sequential buy signal suggests a short-term price rebound, following a downtrend with strong selling pressure and market indecision.
- Stochastic RSI indicates an oversold condition, while MACD shows weakening selling pressure, increasing the likelihood of a bullish crossover.
- If XRP breaks above resistance at $2.40-$2.42, a move toward $2.50-$2.60 is possible; failure may push it toward $2.32 support.
Recent XRP analysis reveals a TD Sequential buy signal on the 4-hour chart, suggesting a possible short-term rebound after a prolonged downtrend. XRP traded at $2.41 at the time of writing amid mixed technical signals and cautious sentiment.
Chart Analysis and Price Action
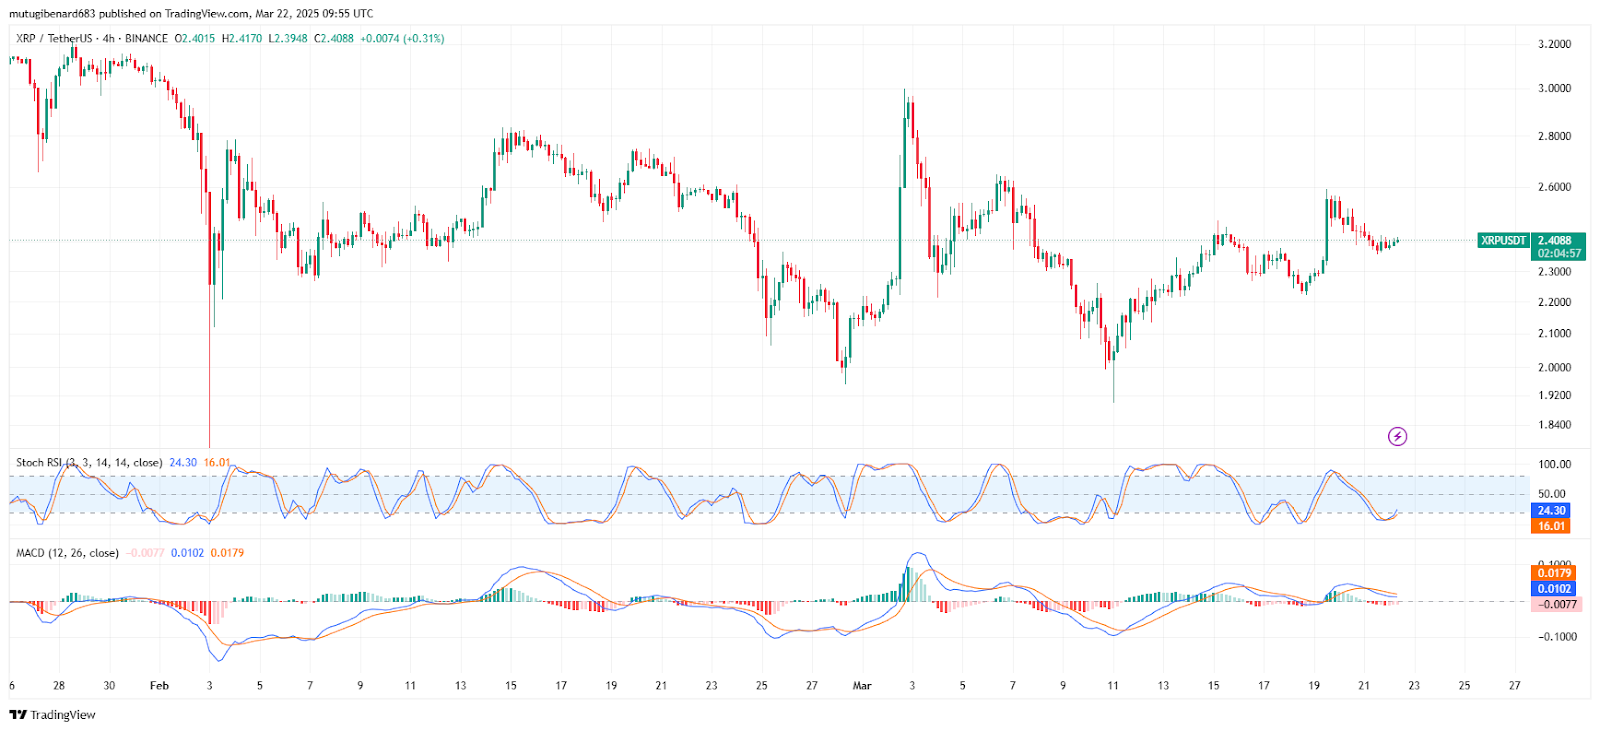
A tweet from Ali_charts noted that XRP flashed a TD Sequential buy signal on the 4-hour chart. The chart shows consecutive bearish candles, indicating sustained selling pressure. A small bullish candle near the right side hints at emerging buying interest. Long wicks on some candles point to indecision and failed reversal attempts.
The price has been confined by a downward trendline that serves as strong resistance. The current level around 2.3949 may act as temporary support during this consolidation phase. Traders are watching this level closely as it could determine if a rebound will occur. The formation of a consolidation pattern raises expectations of a potential breakout once buying pressure strengthens.
Technical Indicators Review
The analysis includes annotations such as a red downward arrow labeled A13, which may signal a bearish alert. A gray upward arrow with a red 9 suggests a potential buy signal, marking the possible end of the downtrend. The dual signals present a mixed picture that warrants careful observation.
Stochastic RSI readings stand at 24.67 (blue) and 16.13 (orange). The oversold zone is below 20, which may signal an early rebound if the indicator moves upward. Meanwhile, MACD values show a blue line at 0.0103 and an orange signal line at 0.0179, with a histogram reading of -0.0076. Although the MACD remains negative, selling pressure appears to be weakening, and a bullish crossover could spark a new uptrend.
Market Scenarios and Outlook
If XRP breaks above resistance around 2.40 to 2.42, the coin may rally toward the 2.45-plus range. A sustained breakout with strong volume would support a bullish outlook for the near term. Conversely, failure to overcome resistance could lead to a drop toward support levels between 2.35 and 2.32.
The current short-term bias remains neutral to bullish, pending confirmation from both the Stochastic RSI and MACD. Market participants are closely monitoring these levels, as a clear signal could prompt renewed buying activity. This technical setup sets the stage for a critical test of XRP’s momentum in the coming sessions.