
- JASMY is trading within a long term ascending channel and is constantly rebounding off its support levels of $0.010 -0.012 which signifies a continuous accumulation by the holders.
- Weekly volume patterns show spikes during support bounces, confirming buyers enter gradually while maintaining control of market movements.
- Price targets point towards mid-channel resistance at $0.020–$0.022, and the upper channel line at $0.06–$0.08 as potential medium-term targets.
The JASMY is in a clear uptrend channel in the weekly chart, which it is consolidating. The new price movement indicates that buyers are entering at important levels of support.
Ascending Channel Dynamics
The $JASMY/USDT weekly chart shows a consistent upward trajectory confined within parallel trendlines. The lower boundary, currently around $0.005–$0.007, has repeatedly acted as support without breaching the channel. This structure demonstrates the ongoing integrity of the bullish trend on a macro scale.
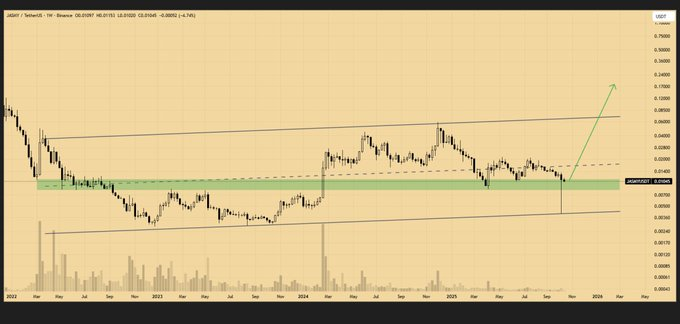
The upper end of the channel is $0.06–$0.08, which is potential resistance for future upside rallies. The weekly candlesticks frequently kiss these boundaries, reinforcing the steady accumulation pattern. Price action within the channel is orderly, indicating controlled market behavior.
Volume behavior further supports the consolidation pattern. Spikes in trading volume coincide with bounces off support and strong rallies, while the current low-volume phase reflects absorption. This indicates that buyers are present but gradually increasing their positions without forcing sharp upward moves.
Key Support Levels
A critical support zone between $0.010–$0.012 has acted as both resistance and support in prior weeks. Recent candles show long lower wicks, reflecting strong buying pressure at this mid-channel area. The zone aligns with internal channel support, providing a base for potential upward movement.
Crypto Mullah tweeted that “$JASMY is consolidating within the ascending channel formation on the weekly timeframe. A new uptrend may start if we bounce from the support zone.” This suggests that market participants are watching for a bounce as a trigger for continued gains.
The repeated validation of the support zone demonstrates confidence among holders. Falling exchange reserves indicate that investors are not selling, hinting at accumulation. Every minor dip appears to attract buyers rather than trigger panic, supporting the consolidation narrative.
Price Projection and Market Behavior
If $JASMY successfully bounces from the $0.010–$0.012 support, the next mid-channel target may reach $0.020–$0.022. Beyond that, the upper channel boundary around $0.06–$0.08 could serve as a medium-term price objective. Green arrows on charts illustrate potential price movement along this trajectory.
Steady accumulation during consolidation suggests that holders are maintaining positions even amid minor fluctuations. Price stability combined with falling exchange reserves points toward a gradual buildup of demand.
Market attention remains subdued, allowing $JASMY to quietly consolidate. Investors observing the weekly chart may view this period as a preparatory phase for future trend continuation. Historical patterns indicate that consolidation within an ascending channel often precedes extended upward moves.