
- TRX is consolidating with support firmly in position at $0.1800 – $0.2200, with the level at $0.3000 still a significant level of resistance.
- Volume trends are hinting at accumulation, and a brea above $0.2600 – $0.2800 would propel TRX in the way of the crucial $0.3000 level.
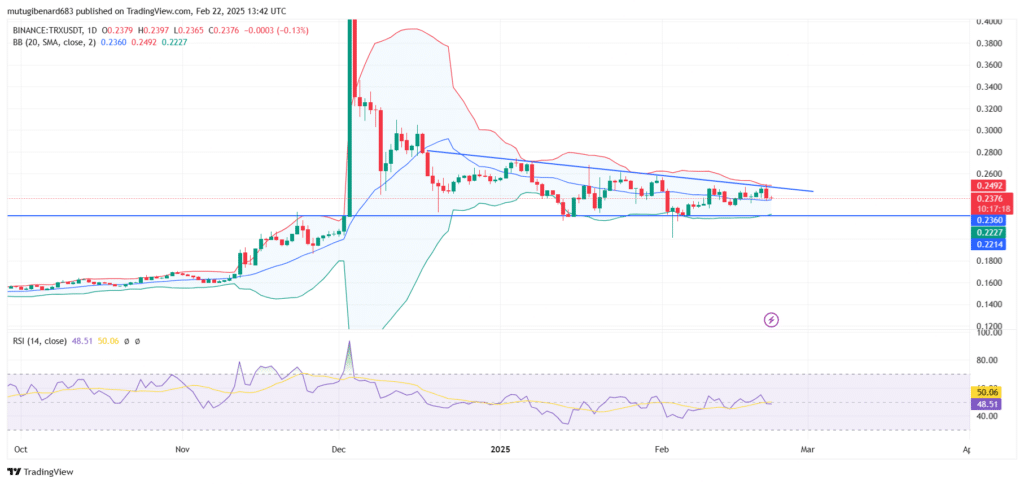
- RSI near 48.8 and tightening Bollinger Bands signal potential volatility with a possible breakout or breakdown determining TRX’s future move.
TRON (TRX) is experiencing a phase of accumulation while closing in on a crucial level of resistance at $0.30. Recent market movement is a possible breakout in the case where purchasing pressure is sustained. Market players are monitoring closely whether TRX is going to hold on a level upward movement or endure a repeat at the level.
A recent tweet on X by CW8900 identified the pivotal selling wall at $0.30 and suggested a seamless appreciation in TRX to such a level. If such a resistance is, the bull run would resume and strengthen the dominant market trend.
Accumulation and Key Support Levels
Following a December 2024 price surge and rejection, TRX went into a consolidation. The asset is developing higher lows. The support is still in the area of $0.1800 – $0.2200 with the old demand in the area of $0.1400 – $0.1600. If the price stays above $0.2200, the potential for further upward movement is still in play.
A major area around $0.3000 – $0.3200 is a challenge for bulls. The level in the past has been a level of rejection. If TRX is going to break above $0.3000, the next major level would be $0.3500. If not going to hold above $0.2200, we would see the price going back and retest lower demand levels.
Volume and Market Structure
Volume trends are characterized by a preceding spike in December, with a decline in trade thereafter. Recent volume, however, still points in the direction of slow and steady accumulation. Breakout above the level at $0.2600 – $0.2800 could see a retest at the level at $0.3000.
A descending triangle on the daily chart places TRX at a critical juncture. The horizontal support at $0.0274 has been held strongly. The downward-sloping trendline continues to limit the upsides with a potential breakout/breakdown scenario.
Potential Breakout or Breakdown
TRX is in a contracting band of Bollinger Bands, a decreasing volatility signal. The RSI is approximately 48.8. Breaking above RSI level 50 would represent increased buying pressure, while falling below RSI level 40 would represent bear pressure.
A bullish breach could drive TRX to $0.030, provided that it closes above $0.0285 – $0.0290 with increasing volume. Alternatively, a dip below $0.0274 could witness a decline. TRX was at a value of $0.2374 at the time of writing and a 24hr trade volume of $728 million. The market looks on in anticipation of a definitive move in the following sessions.