
- TON price is testing the descending triangle’s lower boundary, with strong buyer demand repeatedly defending the $2.62–$2.68 support area.
- Technical indicators including RSI rebound, Bollinger Band expansion, and Stochastic RSI crossover point to potential bullish momentum developing.
- A breakout above $3.12 resistance could drive TON toward $3.32, $4.20, and $4.65, marking critical profit-taking and resistance levels.
The TON/USDT pair is approaching a decisive support area as the token tests the lower boundary of a descending triangle on the 2-day chart. Market analysts are closely observing this structure, with price action showing signs of a potential breakout from a prolonged consolidation phase.
Testing Critical Triangle Support
As analyst Jonathan Carter notices, TON is probing the base of the descending triangle in the $2.62-$2.68 range. This region has been a solid support level since late 2024. Repeated bounces back at this level have consistently attracted buyers, a testimony to great demand at these levels.
The pattern is traditionally considered bearish, yet the extended consolidation period has changed sentiment. Each recovery from support has resulted in upward momentum, suggesting that buyers remain willing to defend this zone. The current setup therefore places TON at a critical decision point.
The RSI has also rebounded from near oversold levels, pointing to a potential momentum shift. Traders are watching closely to see whether the next move will confirm renewed strength or risk a breakdown.
Indicators Signal Possible Reversal
The daily chart provides further evidence of market tension. TON is pressing against a support trendline around $2.61–$2.65, closely aligned with the lower Bollinger Band. Multiple wicks rejecting lower levels show that buyers are stepping in. In addition, a recent volume spike on the dip suggests accumulation.
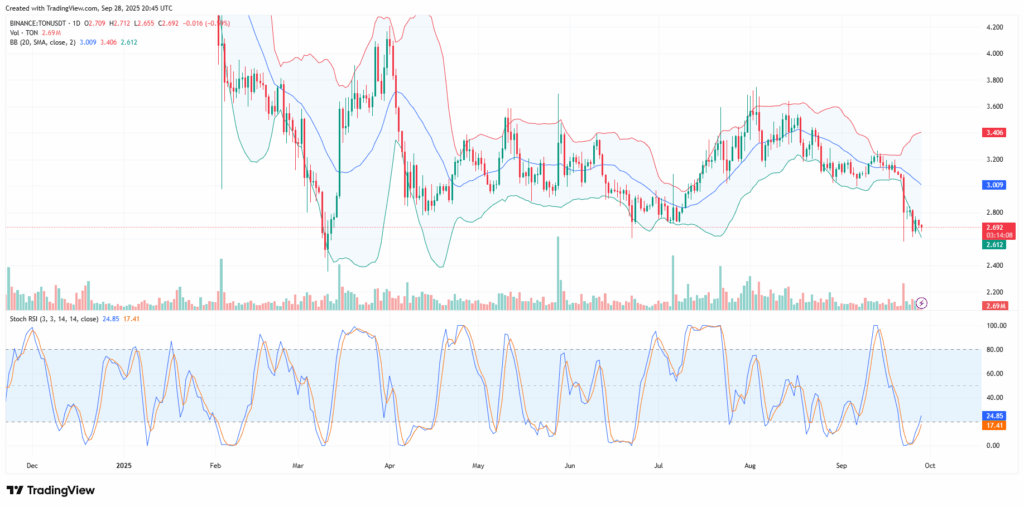
The Stochastic RSI is curling upward from oversold territory and forming a possible bullish crossover. Historically, such signals often precede stronger upward momentum when confirmed by price action. Traders are now monitoring whether this will develop into a sustained reversal.
Bollinger Bands are also beginning to expand, pointing to a rise in volatility. The next step for confirmation would be for TON to reclaim the $2.75–$2.80 range. A close above the Bollinger mid-line near $3.00 would further validate a potential trend reversal.
Breakout or Breakdown Ahead
Analyst Carter shared key upside targets should support hold and momentum shift higher. These include $3.32, $4.20, and $4.65, with the latter marking a notable volume gap zone where rapid price movement is possible. Each of these areas represents expected resistance levels where traders may secure profits.
A determined spike over declining resistance and the 50-period SMA, currently at $3.12, would provide additional confidence for a bullish breakout. Such a spike would also generate FOMO buying or a short squeeze, enhancing momentum.
On the other hand, a breakdown below $2.62 would invalidate this bullish scenario. Failure to hold the triangle’s support could expose TON to deeper declines toward $2.25. The outcome now depends on whether buyers can defend support and push the token beyond resistance levels.