
- TIA failed to break $2.16 and now tests key $1.31 support, suggesting potential for a double bottom or deeper decline.
- A bullish shift may begin if TIA reclaims $1.93, but bearish order blocks threaten any breakout toward $2.10–$2.30.
- Weak volume and declining RSI suggest buyers lack strength, leaving TIA vulnerable if $1.31 support breaks down.
After weeks of sluggish performance, TIA is now near a make or break zone. The asset failed to hold above $2.16 after a mid-July rebound and is trading around $1.60. This decline followed a sharp rejection from a resistance level that marked the end of a short recovery phase.
With the price nearing a historical support around $1.31, eyes are now on whether TIA will form a double bottom or extend its decline further.
$1.31 Support Zone Eyed After Rejection From $2.16
According to Michael van de Poppe, TIA was rejected at the $2.16 resistance zone after a minor rally. This level previously led to profit taking and marked the end of a recovery attempt.
The long term trend is bearish since January, when the price stood above $8.00. Following the recent rejection, TIA now moves closer to its major support at $1.31, which held firm in June and early July.
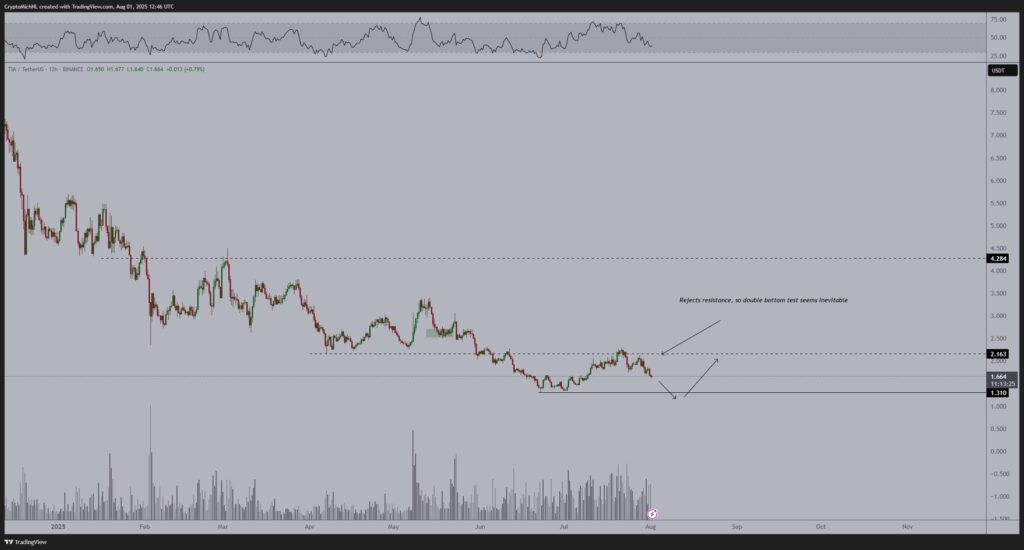
The rejection confirms bearish pressure still dominates, but two scenarios remain possible. Either a higher low forms and price attempts another breakout, or a double bottom develops around $1.31. The RSI currently trends down from the overbought zone, weakening the buying strength. Volume also is subdued, offering little support to bullish momentum.
Smart Money Levels and Fair Value Gaps
A second perspective from BullishBanter points to a reaction after sell side liquidity was swept at around $1.742. Price rebounded and entered a cluster of overlapping Fair Value Gaps between $1.84 and $1.93.
This range is key now, with TIA attempting to climb back into the short term supply zone. A Market Structure Shift occurred above $1.82, suggesting a potential bullish reversal if volume increases.
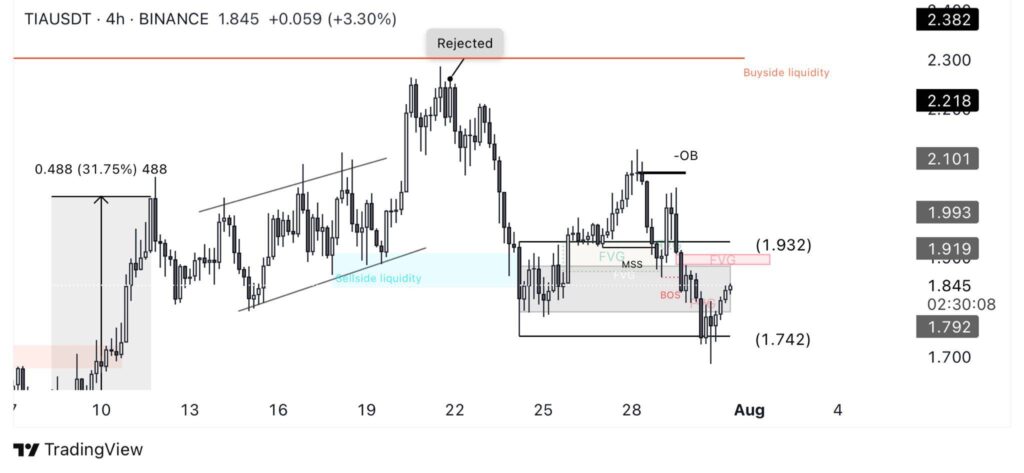
However, bearish Order Blocks still surround the $1.93 and $1.99 zones, threatening any upward momentum. If the price breaks above these levels, it could fill the imbalance up to $2.10 or $2.22. But failure to do so may expose $1.74 again and possibly lower levels if sell-side pressure resumes.
High Stakes Between $1.93 Resistance and $1.31 Support
Despite the short rally, the outlook is fragile. TIA must now reclaim $1.93 to shift momentum in favor of bulls. A move beyond this level could lead to $2.10 and even $2.30. However, continued rejection near the $1.93 zone may push the price back toward the $1.31 support, or potentially leading to new lows.
Currently, TIA trades between zones that could either trap sellers or fuel new buy orders. With bearish pressure still present and volume showing little improvement, it remains to be seen how price reacts at these levels. The outcome at these points will decide whether a reversal is near or if the downtrend continues.