
- TAO forms a falling wedge on the 1-hour chart, showing higher lows and potential breakout toward a 29% short-term gain.
- 24-hour price chart reveals steady recovery, with buyers maintaining control during shallow pullbacks and consolidations around $330–$345 levels.
- DeFi Total Value Locked rose to multi-year highs, a sign of renewed investor confidence and strong liquidity growth in the sector.
TAO is showing signs of a potential bullish reversal as its price action nears a crucial breakout point. Buyers are gradually gaining strength and momentum patterns look ready for a possible upward move if resistance is breached.
TAO Falling Wedge Pattern Signals Bullish Movement
Recent technical analysis of TAO/USDT shows a well-defined falling wedge pattern forming on the 1-hour chart. The price has been contained within converging trendlines, demonstrating repeated touches on support and resistance.
Each test of the lower boundary has seen buyers step in, maintaining the wedge’s structure.The price is approaching the upper resistance line, signaling an attempted breakout.
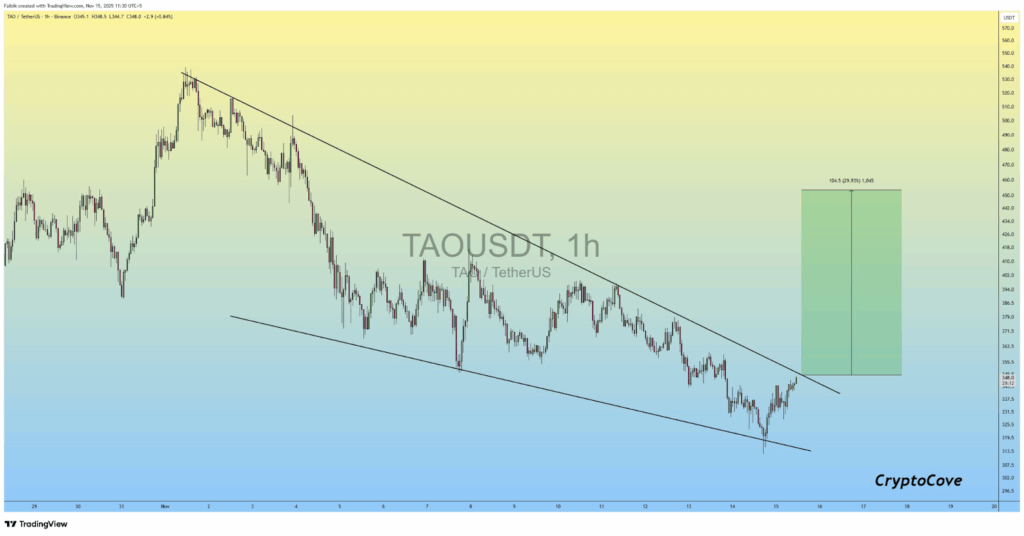
Micro-movements reveal higher lows forming, reflecting growing buying pressure in the market. This pattern aligns with traditional interpretations of a bullish reversal setup.
A projection box on the chart suggests a potential upside of around 29% if the breakout occurs. Price levels near 350 could extend toward 450 in the short term, indicating a defined bullish target. Consistent volume supports the stability of this trend.
24-Hour Price Performance Shows Steady Recovery
TAO’s recent 24-hour chart illustrates a generally upward trajectory despite intraday swings. The price started between $315 and $320, briefly dropping before rising to higher levels. This movement indicates improving market sentiment.
Momentum picked up mid day and the small pullbacks that occured were shallow.This shows that buyers stayed in control as prices fluctuated between $330 and $345 keeping the overall uptrend continuing steadily.
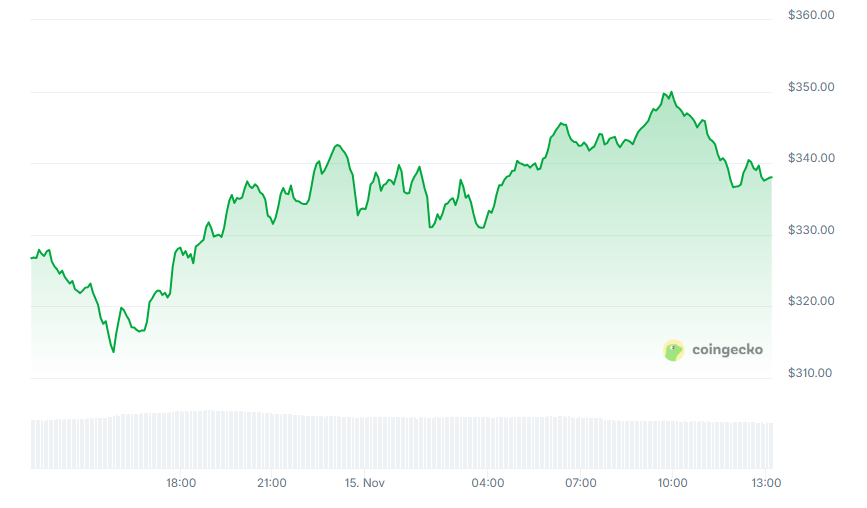
The highest point slightly exceeded $350, followed by a correction to the $340 range. Volume bars remained steady, indicating even trading activity without sharp spikes. This pattern suggests a healthy, momentum-driven climb.
DeFi Total Value Locked Shows Resurgence
Total Value Locked (TVL) in DeFi has experienced a slow growth phase from 2018,before a rapid rise starting in 2020 when yield farming boom and on-chain liquidity drove TVL past $30 billion.
Volatility increased with sharp peaks and declines caused by macroeconomic events and protocol instability.TVL dropped significantly toward the $40–$50 billion range during the post-Luna and Celsius period.
From then onward, TVL stabilized and began climbing again,approaching previous peaks near $150 billion demonstrating renewed confidence and broader adoption in the DeFi sector and showing resilience after prior declines.