
- $TAO broke its symmetrical triangle structure after rejection at $320–$330, signaling sellers remain in control with downside pressure building.
- Immediate support sits at $300, with the $250–$225 zone viewed as a potential buy area where renewed demand could appear.
- Stochastic RSI shows oversold conditions, while MACD remains bearish, confirming downside strength despite a possible short-term relief bounce.
$TAO Daily Outlook points to continued bearish pressure after the token lost its symmetrical triangle structure and failed a retest attempt.
Breakdown of Symmetrical Triangle Structure
CryptoPulse reported that $TAO recently broke below its symmetrical triangle, ending its previous consolidation phase. The breakdown occurred after price slipped beneath the lower ascending trendline, which had been supporting recent movements. A subsequent retest near $320–$330 was rejected, reinforcing the presence of sellers.
The current daily chart shows $TAO testing the $300 level, which is acting as immediate psychological support. Failure to hold this level could allow further downside movement. Market observers are now monitoring whether the token will extend its corrective phase toward deeper support areas.
Price rejection from the broken structure signals increased selling interest. A clear shift in momentum has appeared, with downside pressure outweighing recovery attempts. Unless price reclaims the former trendline, bearish control is likely to persist in the near term.
Key Support and Resistance Zones
The $250–$225 area has been identified as a possible bounce zone. This range previously served as a strong base during April’s trading activity and may attract renewed buying interest. This level is being monitored closely by traders to see if dip-buying occurs.
On the upside, resistance is anticipated around the $330 -$340 level with the broken trendline being a pivotal resistance. Any retracement back toward this area is likely to encounter selling pressure.This level is being monitored closely by traders to see if dip-buying occurs.
On the upside, resistance is anticipated around the $330 -$340 level with the broken trendline being a pivotal resistance. Any retracement back toward this area is likely to encounter selling pressure.Any retracement toward this area could encounter selling pressure. A sustained move above this region would be required to shift sentiment back in favor of buyers.
CryptoPulse noted that without confirmation from price action, entering long positions prematurely may expose traders to additional downside risk. This reinforces the importance of patience during correction phases.
Indicators Point to Oversold Conditions
Technical indicators support the current bearish outlook, although signs of exhaustion are emerging. Stochastic RSI is now below 20, with both %K and %D lines hovering near three. This positioning suggests that $TAO is oversold and may soon experience a short-term relief bounce.
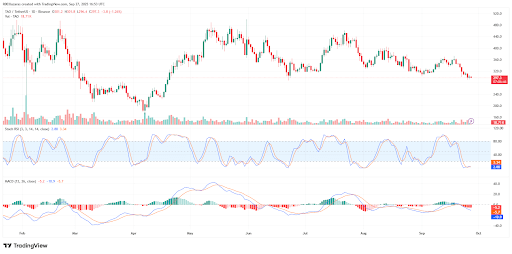
Meanwhile, MACD readings remain negative, showing continued downward momentum. The MACD line sits at -10.9 compared with the signal line at -5.7, while histogram bars remain red. This setup confirms that bearish momentum is still strong.
Together, the Stochastic RSI and MACD show oversold conditions but persistent selling strength. Market watchers suggest monitoring a potential crossover in the Stochastic RSI, which could signal an early attempt at recovery.